Defining Report Factor Sets
The Metrix Asset Management system offers the Cost to Bring to Satisfactory Report as a built-in report template for users. This report calculates intervention metrics for components based on their condition a pre-defined factor set. This guide details how to create and manage such factor sets.
-
Navigate to the ‘Reports’ page of the application.

-
From the report template list, select ‘Cost to Bring to Satisfactory Report’.
-
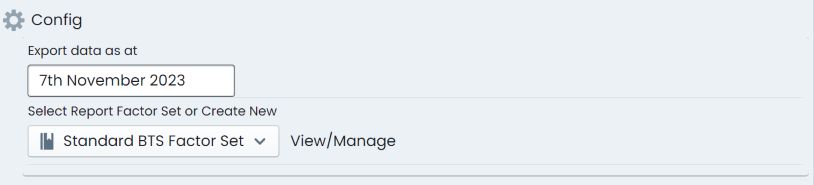
This will take you to the generation/configuration page for this report option. The current chosen ‘Factor Set’ will be active in the ‘Report Factor Set’ drop-down. If you have never created your own ‘Factor Set’, this will be a system default set.
-
To create a new ‘Factor Set’, select ‘Create New Factor Set’ from the drop-down list options. To edit the active ‘Factor Set’, click on ‘View/Manage’ next to the drop-down list.
-
If creating a new ‘Factor Set’, enter a ‘Factor Set Name’ in the text input box. Then select the ‘Report Category’ for which this ‘Factor Set’ will apply to. If editing, the existing ‘Factor Set’, click ‘Edit’.
-
For each option configured for the report category, an array of factors will be generate per scaled condition score of 1-5. These are placeholders for you to replace with your actual factors. To set the factors, there are two options:
Set Globally
The top row of the list is reserved for global assignment. That is, this row does not pertain to a particular report category option - it is there to allow you to set a figure that will be replicated across ALL report category options below.
Set Individually
Excepting the top row, each row represents a configured report category option. These rows can be individually managed by inputting values directly.
-
First, choose a factor base as ‘Replacement Value’ or ‘Carrying Value’. This is the metric that will be multiplied by the report factor per scaled condition score.
-
or each scaled condition score across the row, input the desired report factor from 0% to 100%.
-
When you have finished, click ‘Save’ at the top of the table.