This section covers some of the more basic functions of the Metrix
Asset Management System including:
Getting around the system generally
Interacting with your Assets
Generating Reports
Interacting with Dashboards
Working with Capital Budgets
Using Defects
The general assumption throughout this section is that you have access
to a valid Metrix environment and have been issued with an active
user account for that environment. If one or both assumptions are
incorrect, please contact your system administrator before continuing –
notwithstanding this, feel free to read on.
Subsections of End User Processes
Getting Around
This section covers some of the core usability functions of the Metrix
Asset Management System including:
Initialising a new user account & logging in to the system
Resetting your password
Basic system navigation
The general assumption throughout this section is that you have access
to a valid Metrix environment and have been issued with an active
user account for that environment. If one or both assumptions are
incorrect, please contact your system administrator before continuing –
notwithstanding this, feel free to read on.
Subsections of Getting Around
About
This section contains basic information about navigating around your Metrix Asset Management system.
Subsections of About
System Navigation
Depending on your account privileges – which will be set by your system
administrator – you will see different functions available to you when
you first login. There are, however, a couple of core system pages that
will be available to you regardless of your account privileges. This
section details some of the basic facets of these pages.
To navigate to each page of the Metrix system, use the section
header located at the top of the application. Regardless of where
you are within the system, this section header will always be
available. The section header will generally look like the
following:
Review the Dashboard Page - The dashboard provides a quick and easy
overview of some core statistics about your assets within the
system. This can be useful for extracting charts and graphs for
generating your Asset Management Plans and Policies. It is also
handy for gaining a high-level snapshot of your asset performance.
Review the Assets Page - The assets page is the main engine room of
the system. This is where users can view their asset portfolio
through an intuitive map interface, fetch information, as well as
perform edits on that information.
Review the Capital Page (permissions dependant) - The capital page is where you can
manage your capital works projects. This includes the ability to
create, edit, and track the progress of projects, as well as view
associated costs and timelines. Additionally, you can manage settings
such as the current financial year and the like.
Review the Operations Page (permissions dependant) - The operations page is where you can
manage your operational activities. This includes the ability to
create, edit, and track the progress of operational tasks. These can
include maintenance activities, inspections, and other operational
tasks related to your assets.
Review the Reports Page - The report generation page is full of
predefined report templates to help you extract the information you
need about your assets. Additionally, you can access previously
generated reports from within this page.
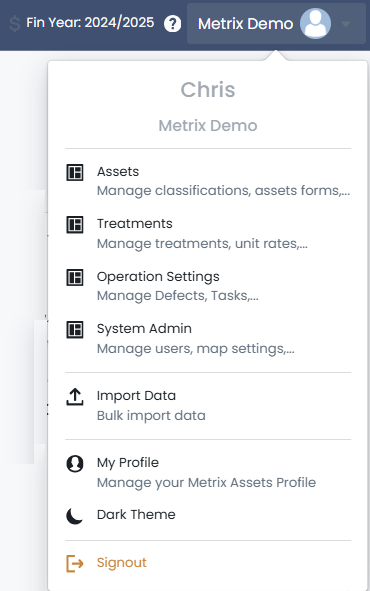
Review the System Menu - In the top right-hand corner of the
application, you will see a menu drop-down labelled with your
organisation’s Site ID. This contains all site configuration
options (if your account has the rights to see such settings). It is
also where you can access and manage your Profile information and
sign out of the application.
How To Guides
This section contains a handful of useful How-To documents on core usability functions of the Metrix
Asset Management System including:
Before you can use your Metrix Asset Management System, you must
have a valid Metrix account with which you can login with. To gain
access to such an account, your organisation’s system administrator
needs to generate an invitation for you to register. If you have not
received an invitation, please consult your organisation’s system
administrator.
Once invited, you will receive an email with your username details as
well as a temporary password that you need to change immediately. Follow
the ‘Sign In’ button from this email to perform the password change.
Info
The email will come from support@metrixassets.com. If you do not receive it within 2 hours, check your junk/spam folders in case it has been captured there.
Your new password must meet the following requirements:
Minimum length of 8 characters
No spaces
At least one uppercase letter
At least one lowercase letter
At least one number
At least one special characters (excluding + and -)
Once you set and confirm your new password, you can safely delete the
invitation email. Please note that the invitation email will expire
after 7 days. At which time, a new invitation will need to be generated.
Logging in to Metrix
To log in to your Metrix Asset Management System environment, you
will need to know your organisation’s Site ID and have a valid username
and password for that environment. Your organisation’s Site ID is used
within the web URL of your system.
Example
If an organisation’s Site ID was “Smithtown”, then the web URL for accessing
that system would be www.smithtown.metrixassets.net
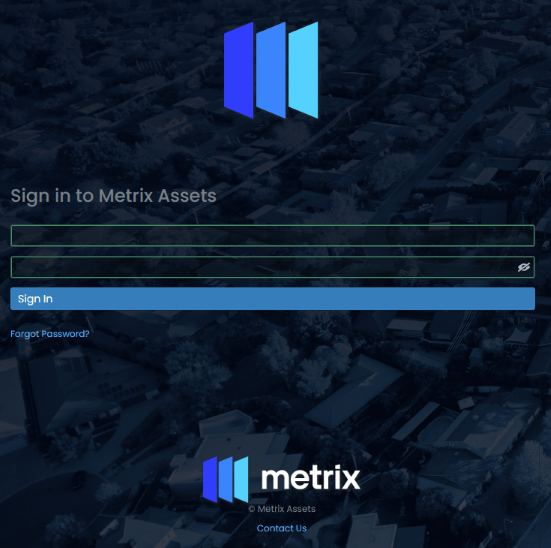
Once you enter your organisation’s web URL, you will be presented with a
login page. This page is requesting your username – which is your email
address – and the password that you have defined when initialising your
Metrix account (see Initialising a Metrix account
for details on this).
Resetting your Password
If at any time, you forget your password for the Metrix Asset
Management System, you can request a password reset from the main login
page. To do this, complete the following steps.
Click on “Forgot Password” below the “Sign In” button and you will
be redirected to the password reset page.
Enter your username – which is your email address – and click
“Reset Password”.
At this point, you will be redirected to a password reset
verification stage. A verification code will be emailed to your
email address.
Once you have received your email, enter the verification code along
with a new password. The new password must also meet the password
requirements stipulated above (see
Initialising a Metrix account
for details on this).
Info
The email will come from support@metrixassets.com. If you do not receive it
within 2 hours, check your junk/spam folders in case it has been captured there.
Basic Functions
This section provides an overview as well as useful tutorials on some of the more basic functions of
the Metrix Asset Management System including:
Using the Map View
Information Panels
Basemaps and Focus Modes
Custom Filters
Map Themes (Visualisations)
The Actions Menu
Collections
Spatial Features
Residual Life Calculations
Financial Movements
The general assumption throughout this section is that you have access
to a valid Metrix environment and have been issued with an active
user account for that environment. If one or both assumptions are
incorrect, please contact your system administrator before continuing –
notwithstanding this, feel free to read on.
Subsections of Basic Functions
About
This section covers some of the more basic functions of the Metrix
Asset Management System including:
This page covers some of the basic navigation options available within the core ‘Assets’ page
in the Metrix Asset Management system including:
Pan / Tilt / Zoom the map window
Info Tool
Search
Map Window Pan / Tilt / Zoom
The built-in map window inside the main ‘Assets’ page supports various computer mouse gestures
to interact with the map location and view. These are detailed below:
Info
These notes assume a standard right-hand mouse configuration with scroll wheel.
Pan:
Panning a map means to shift the map image relative to the display window without changing the viewing scale.
To pan the map window, hold down the ’left’ (main) mouse button and drag your cursor. The map
will follow until you release the mouse button.
Zoom-In:
‘Zooming in’ refers to the action of adjusting the view of the map to make a specific area appear larger and closer.
To zoom in, scroll the mouse wheel up.
Zoom-Out:
‘Zooming out’ refers to the action of adjusting the view to make the image or area ot he map appear smaller and farther away.
To zoom out, scroll the mouse wheel down.
Rotate:
‘Map rotation’ is a way of viewing the map window from a different orientation.
To rotate the map view, hold down the ‘right’ mouse button and drag your cursor
to the left of the map window. The map will continue to rotate in a clockwise direction
until you release the mouse button.
Note: to rotate counter-clockwise, drag the cursor to the right.
Tilt:
‘Map tilt’ refers to the angle at which the map is being viewed from. By default, the tilt is ‘flat’ and being viewed from directly above.
When ’tilted’, the map view is angled so that the user feels they are looking ‘along’ the map.
To tilt the map view, hold down the ‘right’ mouse button and drag your cursor
up to the top of the map window. The map will continue to tilt until you release the mouse
button.
Note: to reverse the tilt, drag the cursor down.
Info Tool
In order to interrogate an asset via the main ‘Assets’ page map window, pan & zoom the map window
to the asset location and single click (left-click) on the asset’s spatial feature.
Info
Remember, click and drag will pan the map. Single click to use the Info Tool.
The info panel will appear/populate on the right hand side of the map window when one or more
valid features have been interrogated by a click.
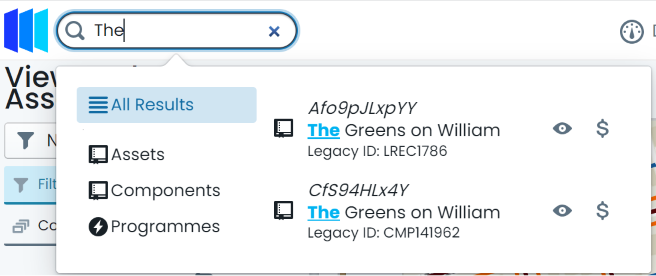
Search
In addition to basic pan and click operations, the Metrix Asset Management system contains a
free text search tool that can navigate and select chosen results for you. To start a search, simply
click inside the search pill at the top of the page, and begin typing your criteria. The following
asset/component fields are included in the search index:
Asset Description
Asset ID
Component Description
Component ID
The search tool will begin looking for results immediately and render them in a box below the search pill.
By default, ‘All Results’ will be shown. Users can however, refine their results to the following
result levels:
Assets
Components
Programmes
Info Panels
This section details the info panels available within the core ‘Assets’ page in the Metrix Asset
Management system including:
The component info panel displays information as it pertains to the selected/active component.
The component info panel has the tab title of ‘Info’. The following sections are included in the
component info panel.
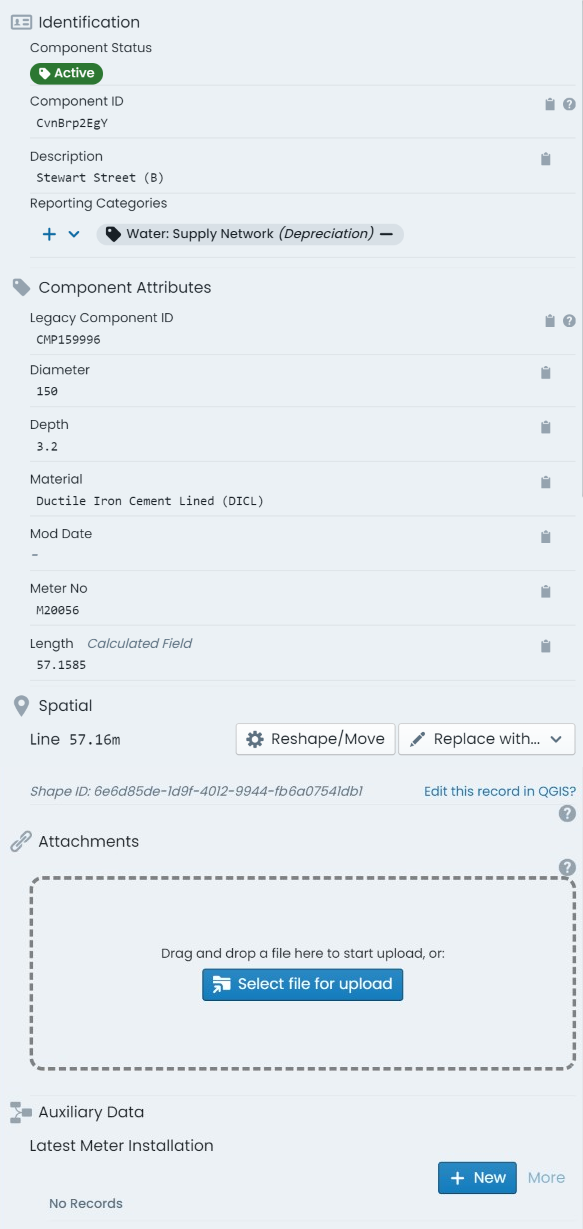
Identification:
Contains identifying information for the component including:
Status: a tag indicating the current status code of the component.
Component ID: the unique component ID for the component automatically set by the system.
Barcode Value: any barcode value assigned to the component for in-field identification.
Description: the brief description value set by end users for the component.
Report Categories: an array of tags indicating any report categories/options assigned
to the component.
Component Attributes:
Renders the custom form definition assigned to the component’s
component group (if any). Each form field will be displayed in accordance with the
form definition’s layout specification.
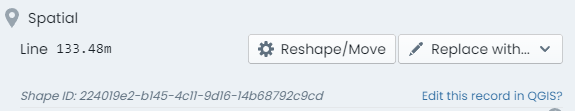
Spatial:
Provides basic information about the component’s underlying spatial feature as
well as access to tools to update or replace the geometry definition. Additionally,
the unique Shape ID value for the spatial record is displayed at the bottom of this section.
Attachments:
Displays a panel where users can interact with existing component
attachments and upload new attachments. Any existing attachments can be clicked on to view,
download, or manage. Users can also simply drag and drop files into this section to create
new attachments against the component.
Task Types:
Renders a list of task records attributed
to the component. Users can also create new task entry from this section.
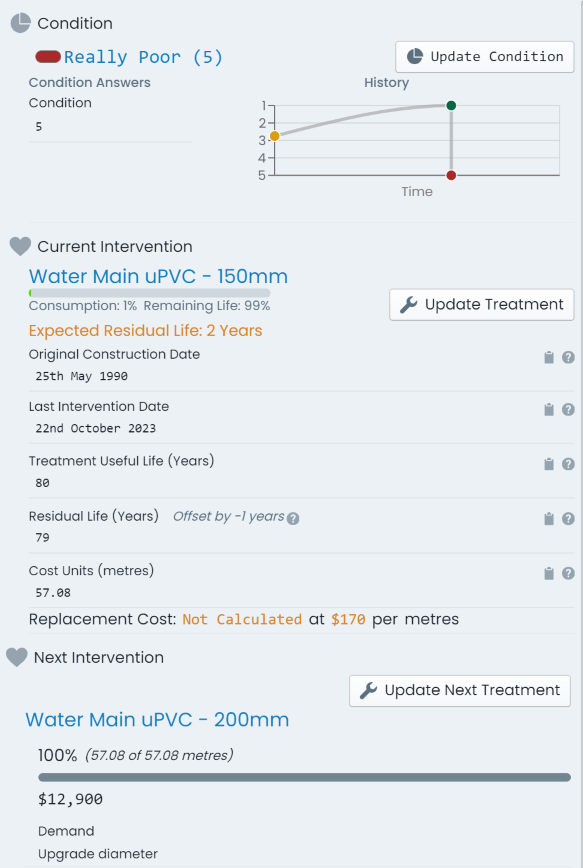
Intervention Info Panel
The intervention info panel displays information as it pertains to the lifecycle metrics of the selected/active
component. The intervention info panel has the tab title of ‘Intervention’. The following sections are included
in the intervention info panel.
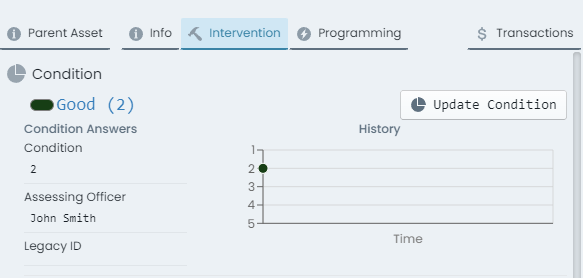
Condition:
contains information about the latest condition assessment for the component. Additionally,
a button (‘Update Condition’) is provided for updating the condition with a new assessment. Lastly, a graph displaying the
change in condition over time is presented for context.
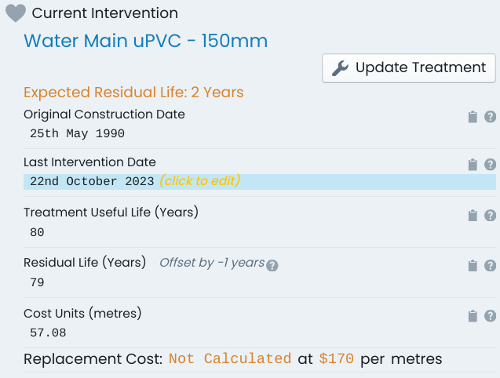
Current Intervention:
contains information about the current state of the component including:
Current Intervention Treatment: the current treatment definition assigned to the component.
Original Construction Date: the date the component was originally commissioned.
Last Intervention Date: the date the component last underwent capital intervention.
Treatment Useful Life (Years): The number of years that the component is expected to be in service before
its next capital intervention.
Residual Life (Years): The remaining service life of the component until its next capital
intervention is due. This includes any ‘Residual Life Offsets’ that may apply.
Cost Units (UOM): The current cost unit value ascribed to the component. Note: The ‘UOM’ (unit of measure)
is defined by the assigned ‘Intervention Treatment’ definition - i.e. ‘metres’. In the case where a cost
unit formula is in force, this will be a read only field.
Additionally, this section contains a button (‘Update Treatment’) linking to a panel that allows users to update the current
intervention treatment.
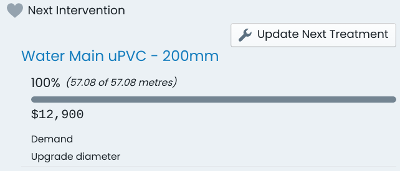
Next Intervention:
contains information about any slated next intervention treatment definition. The recorded
intent and scope of the next intervention is detailed alongside a button (‘Update Next Treatment’) linking to a panel that allows users to update the next intervention treatment.
Transactions Info Panel
The transactions info panel displays information as it pertains to the financial transaction ledger of the selected/active
component. The transaction info panel has the tab title of ‘Transactions’. The following sections are included
in the transactions info panel.
Finance Summary:
contains a snapshot of the current ‘Gross Value’, ‘Depreciable Value’, ‘Accumulated Depreciation
Value’, and the ‘Carrying Value’. These figures represent the financial position of the selected/active component
including all of its active financial transaction ledger postings.
Info
When an intervention treatment has been assigned to the component, and valid rates exist, the ’ value summary pills also
display a calculated value field based on the relevant rates and residual life.
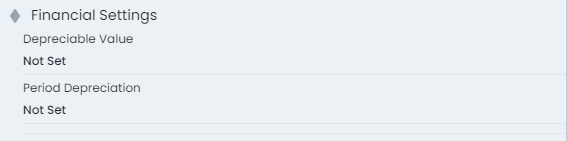
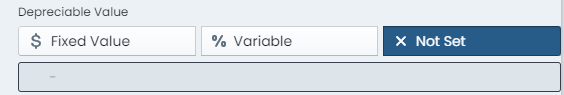
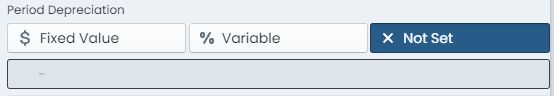
Financial Settings:
provides an interface for users to view and manage the selected/active components depreciation
settings - which are optional and, presently, for information purposes only. Users can view/set the depreciable value
of the component as either a fixed value, or a percentage share of the components gross value. Likewise, users can set the
annual depreciation rate for the component as either a fixed value, or a percentage share of the components value.
Transaction History:
this sections provides a table view of every active financial ledger transaction posted
against the selected/active component. Each row details the transaction type, finance category, posting date, and
posting value of the entry. Additionally, each row has an option to delete the transaction posting (if permitted).
Info
The option to delete a transaction posting is only permissible in the following circumstances:
The transaction is the most recent posting (top row of the table), and
The transaction did not occur during a locked financial period.
Lastly, above the transaction history table, reside options to create new financial ledger transaction entries (‘New Transaction’)
as well as performing a financial reclassification (‘Reclassify’) of the component.
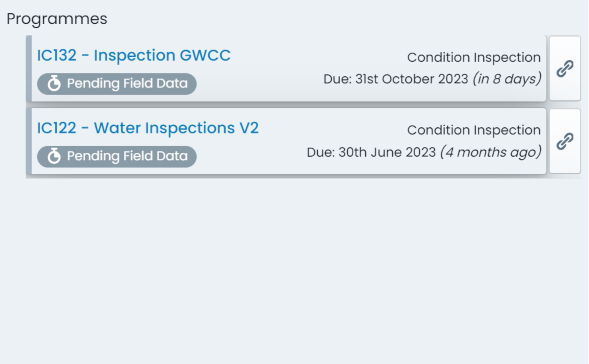
Programming Info Panel
The programming panel displays details on any mobile programmes that the selected/active component
is an item within. For each related programme, users are provided with an overview of the programme name,
due date, and current completion status.
Clicking on a programme item will bring up a panel providing additional information about the component
item within the programme.
Beta Feature
Elements of the Programme system are still flagged as beta products. As such, some of the items and information
accessible through this panel are subject to change.
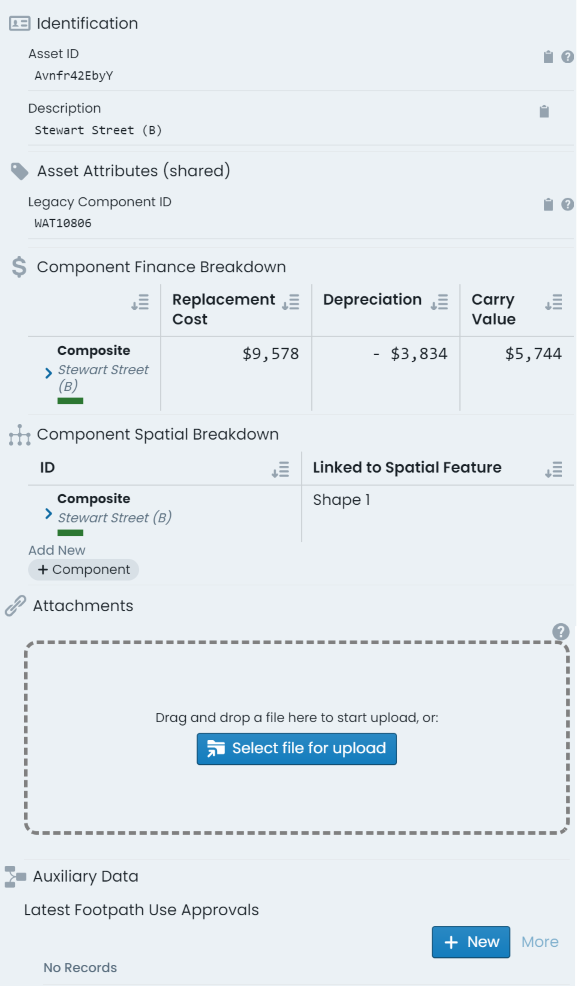
Parent Asset Info Panel
The parent asset info tab provides information pertaining to the parent asset of the selected/active
component. The parent asset info panel has the tab title of ‘Parent Asset’. The sections detailed below
are included in the parent asset info panel.
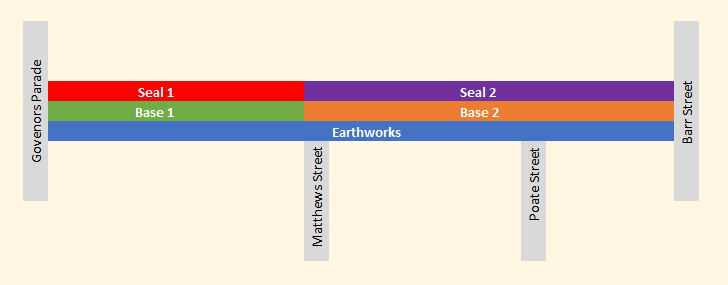
Example
Consider a road asset with three (3) components - earthworks, base, and surface. Each of the components
would have their own unique component info panel, intervention info panel, transactions info panel, and
programming info panel. That is, each time you change the active component, the information contained within
these panels will update to reflect the new entity.
The parent asset info panel is constant regardless of the active component. The information displayed on this
panel will only change when a different asset is activated. Likewise, any details edited on the parent
asset info panel will persist for any of the ‘sibling’ components across the asset. That is, the information
is shared.
Identification:
contains identifying information for the asset including:
Asset ID: the unique asset ID for the asset automatically set by the system.
Barcode Value: any barcode value assigned to the asset for in-field identification.
Description: the brief description value set by end users for the asset.
Asset Attributes (shared):
renders the custom form definition assigned to the asset’s
classification (if any). Each form field will be displayed in accordance with the
form definition’s layout specification.
The ‘shared’ reference in the section’s header is simply communicating that the
information within this panel is shared across all child components of the asset.
Component Spatial Breakdown:
as each component within an asset can be defined by either
a common/shared geometry, or a distinct geometry to that component, the component spatial
breakdown provides a context for the spatial features used across the asset..
Attachments:
displays a panel where users can interact with existing asset
attachments and upload new attachments. Users can interact with existing asset
attachments and upload new attachments. Any existing attachments can be clicked on to view,
download, or manage. Users can also simply drag and drop files into this section to create
new attachments against the asset.
Task Types:
renders a list of task records attributed
to the asset. Users can also create new task record entries from this section.
Info Panel Tools
This section discusses the following info panel tools that exist and/or can be
used regardless of the specific info panel you are viewing at the time. These tools are situated
above the core info panel sections and are always visible (whilst the info panel is open).
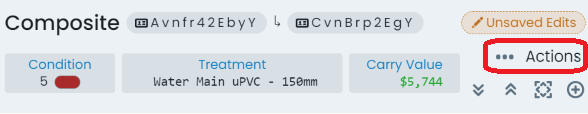
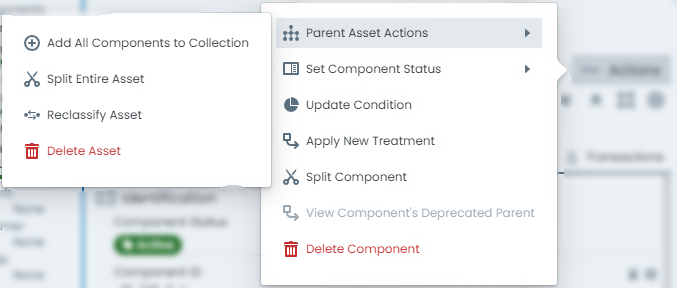
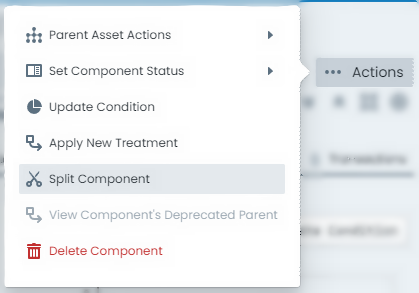
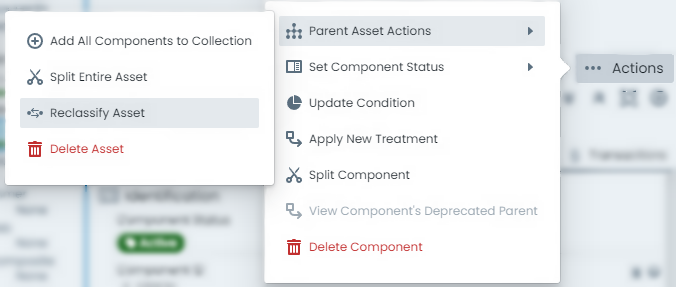
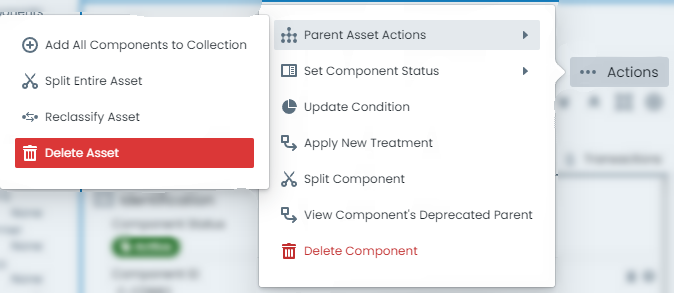
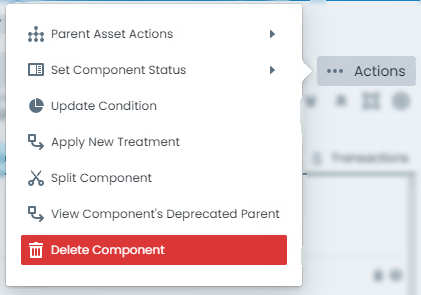
Actions Menu:
The ‘Actions’ menu contains a list of asset and component related actions that can be completed using
the system. Depending on the selected asset and/or the active component, various options in the actions menu
will be enabled and disabled.
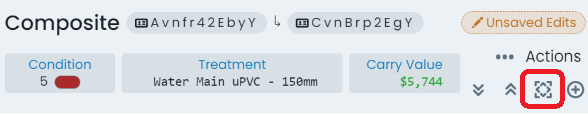
Zoom to component:
The ‘Zoom to Component’ button is located in the top-right hand corner
of the info panel, outside of any other content panels (i.e. component info panel, transaction
info panel, etc.). When clicked, the map window will pan and zoom to reveal the extents of the
active component.
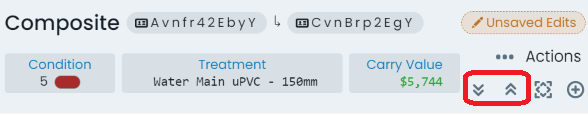
Panel expansion and collapse:
The expand and collapse options provide users with the ability
to collapse all of the info panel sections into flatter, header only, sections. This can be useful on smaller
resolution monitors, when looking for a certain section header. Conversely, the expand button will
display every info panel’s content.
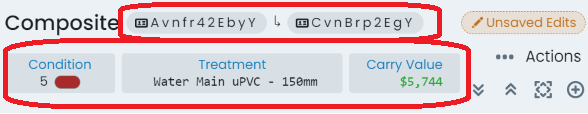
Shortcut pills:
The shortcut pills give quick and easy access to core data like condition,
carrying value, and ID values. Furthermore, clicking on the pill will take users through to the
appropriate info panel for further information.
Add to collection option:
The ‘Add to Collection’ tool allows users to include the selected/active
component in the current (or new, if none is current) collection set. Note: When the component is already
included in the collection set, this button will change to ‘Remove from Collection’.
Edits Options:
When the selected/active component has been modified, this pill acts as a menu that
renders information about the data that has been modified (when clicked). Further to this, users can
revert any pending changes against the selected/active component by clicking ‘Rollback’ in this menu.
Classification Shortcut:
At the very top of the info panel, next to the classification label, exists
a settings button that will take users through to the classification configuration page for the
selected/active components classification.
Close Info Panel:
To close the info panel completely, simply click the ‘X’ icon in the top-right hand
corner of the info panel.
Other Useful Info Panel Tools
Component group switch:
On the left-hand side of the info panel is the active component switcher. This
side panel displays all of the assets components, with the current active component highlighted. Users can simply
click on a different component in this list to switch the info panel to displaying information about that
component. Furthermore, this panel also lists component groups that exist on the asset classification definition,
but do not have any assigned components.
Copy Field Values:
Throughout all of the info panels, on the right-hand side of any data field, users will
find the ‘Copy Field Value’ button. This will put the value contained in the adjacent field into the users clipboard.
Basemaps & Focus Mode
The Metrix Asset Management system provides built-in access to publicly accessible
aerial photography imagery as well as basemaps as backdrops to your asset portfolio.
These layers provide users with helpful context on the area they are viewing in the map window.
To further assist with seeing asset content in association with these layers, Metrix also
contains some tools to modify which backdrop you are seeing, as well as the colour intensity
of the backdrop in comparison to your asset portfolio.
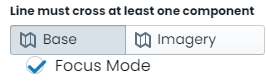
Focus Mode
For nearly all users, there exists a colour combination that is hard to decipher between and thus
difficult to read when displayed in a map window. To cater for this, the Metrix Asset Management
map tools provide users with the ability to put the map backdrop into ‘Focus Mode’. This will
binarise (to make black-and-white) the backdrop so that the colours of your asset portfolio are
easier to distinguish.
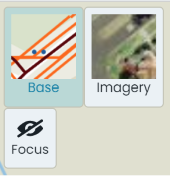
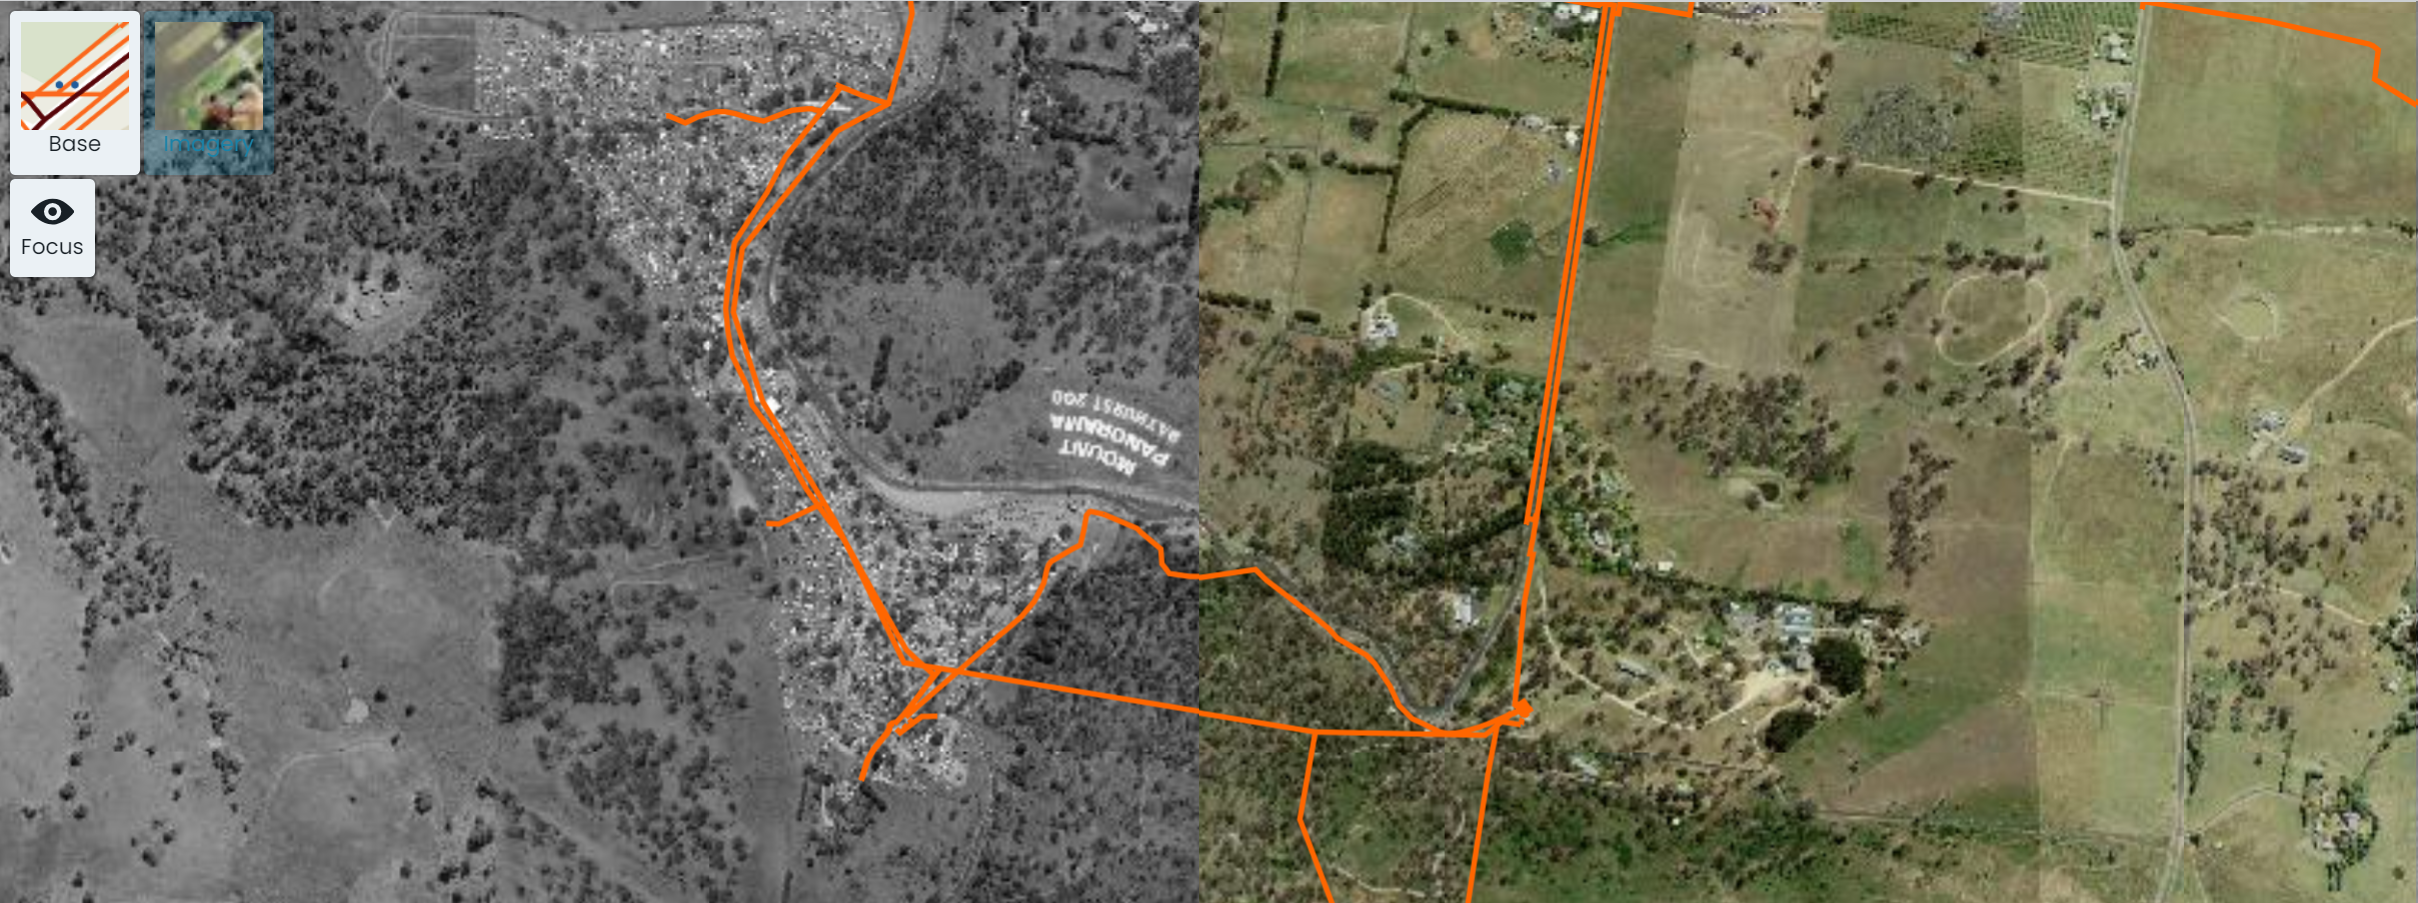
View Aerial Imagery as Backdrop
To view the aerial imagery as a backdrop to your asset portfolio, simply click on the ‘Imagery’
button in the top-left hand corner of the map window. This will swap out the underlying view to
the aerial photograph imagery configured for your environment. The screenshot below shows a map window
with aerial imagery as the backdrop, split between focus mode and standard.
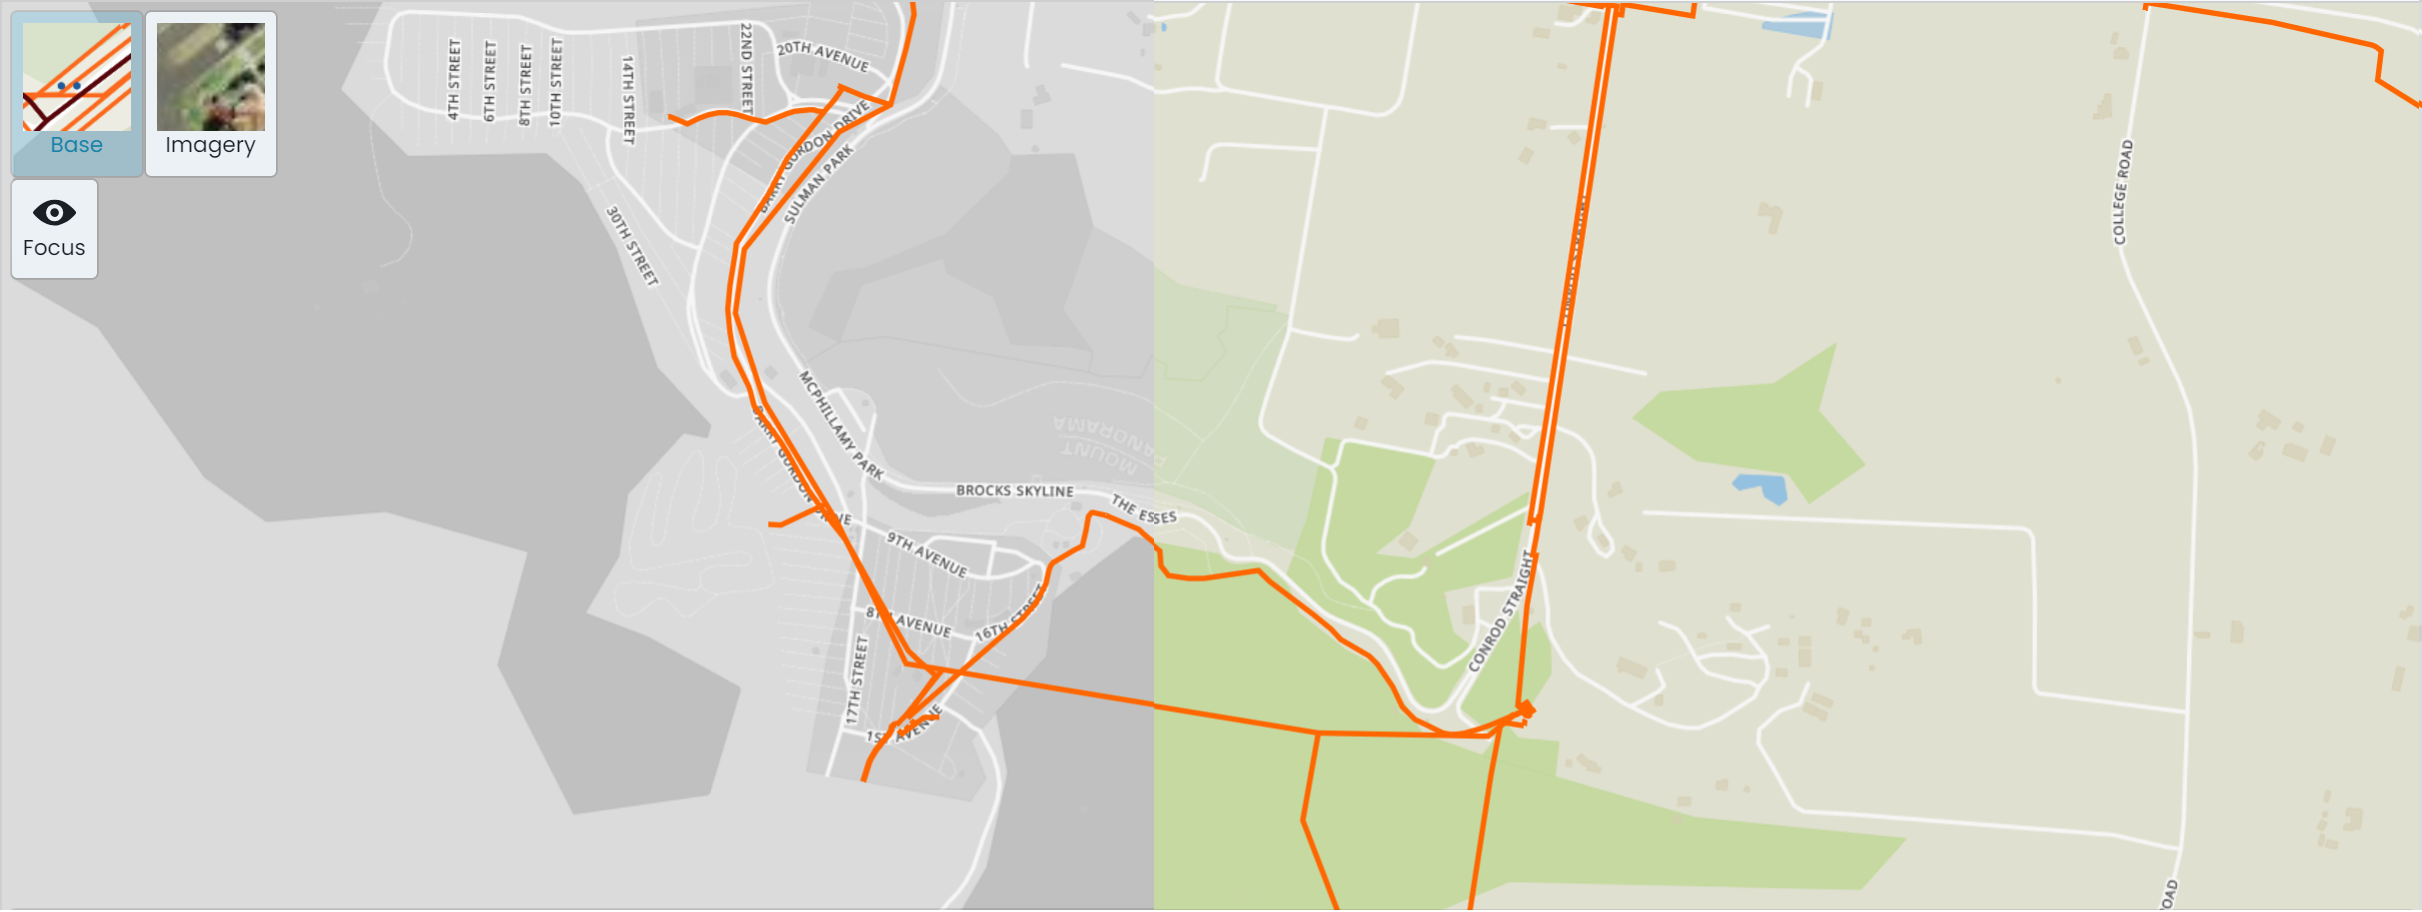
View Basemap as Backdrop
To view the basemap as a backdrop to your asset portfolio, simply click on the ‘Base’
button in the top-left hand corner of the map window. This will swap out the underlying view to
the basemap configured for your environment. The screenshot below shows a map window
with basemap as the backdrop, split between focus mode and standard.
Subsections of Basemaps & Focus Mode
Custom Filters
The Metrix Asset Management system is equipped with a built-in data filtering tool that works
across a variety of pages and functions within the system. This allows users to create and manage
subsets of their entire asset portfolio for viewing, reporting, as well as sharing with other users
of the system. Additionally, the data filtering tools can aid in highlighting asset management
targets within your asset portfolio - filters can be combined to create multiple restrictions on
included components.
Example
Filters can be used to find ‘problem’ assets, or those that may require review for capital intervention.
For example, you could build the following filter to find expiring road surfaces:
Classification = Transport > Roads > Local Roads > Sealed
Component = Road Surface
Condition = Really Poor
Residual Life = Less than 5 years
Applying the above filter will restrict the displayed components to only those meeting this criteria.
Saving & Sharing Filters
Once a filter has been configured, users can choose to save that filter for later reuse. Saved filters can also
be shared so that all users of the system can leverage that filter set.
Info
Saved filters will regenerate matching results every time they are selected. That is, the parameters are
saved for reuse, not the list of result components. This means users can save a filter, and check back in on
the components that fall in and out of its result set over time!
Filters across the System
In addition to the core ‘Assets’ page map window, the filter tool works across the Metrix Asset Management
system in areas such as:
Dashboards,
Report Exports, and
Capital Budgeting
This means that users can define a filter once, and then, view dashboard widgets as they pertain to that reduced
data set only. Further more, users can create a filter and then export the results of that filter to a CSV report
by choosing the filter in the reports page.
Filter Options
The following options are filterable in the Metrix Asset Management System:
Asset Classification
Component Group
Status Code
Reporting Category
Condition
Useful Life
Residual Life
Next Intervention Year
Metric Values (area, length, diameter, height, length, volume, and width)
Component ID list
Map Themes (Visualisation)
The Metrix Asset Management system is equipped with a built-in map theming tool that works
automatically with your data and attributes. This allows users to visualise breakdowns of
their entire asset portfolio, assisting in better and faster decision making. Additionally,
these visualisation tools can aid in highlighting asset management targets within your asset portfolio.
Info
Remember, the Metrix Asset Management system controls spatial features at a component level. When
viewing some map themes, there may be overlapping shapes caused by stacked geometries of multiple
asset components. This can cause obscuration and/or blending of the rendered colours.
In these cases, it is advisable to filter
your data to a specific component group.
Available Map Themes/Visualisations
There are a number of built-in map theme visualisations that are ready to work immediately for you. These
cover a range of areas from lifecycle theming, to report category visualisations. The following details some
of the available themes. This is not an exhaustive list, but provided for context on the types of themes provided.
General Map Themes
These map themes switch around the asset classification and status.
Asset Class
This is the default visualisation theme for the system. Each component is coloured according to
its Asset Class (the first level of the asset classification structure).
Component Group
This theme colours according to the Component Group level of the classification structure. This offers far more
granularity than the Asset Class theme.
Users should be aware of potential stacked geometry issues when using this theme.
Status
The status theme colours each component geometry according to its current status code.
Intervention Map Themes
These map themes aim to highlight the lifecycle metrics associated with your asset portfolio.
Condition
The condition theme displays components on a colour gradient from green (1 - excellent) to red (5 - really poor).
Residual Life
This theme converts a component’s residual life to a percentage of its overall useful life. The result is then
displayed on a colour gradient from green (100% remaining life) to red (0% remaining life).
Construction Year
This displays components in a accordance with their recorded original construction date. This is a useful data audit tool
as it will highlight anomaly records (in comparison to the surrounding asset components).
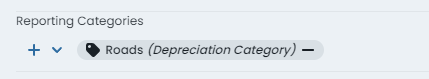
Report Categories
The system takes each of your configured report category configurations and automatically creates a map theme to render
each component in accordance with their assigned option within that category (including missing or no assignments).
The map theme switcher will render an option for each configured report category.
Metric Attributes
The custom attribute form specifications contain several restricted attribute names that relate to component metrics such as
width, length, height, etc. If any of these fields are implemented within your component custom attribute definitions, the
map theme generator can style your geometries based on these numeric results.
Custom Attributes
Any custom attribute definition that is controlled by an option list will be available within the map theme switcher for render.
Collection Sets
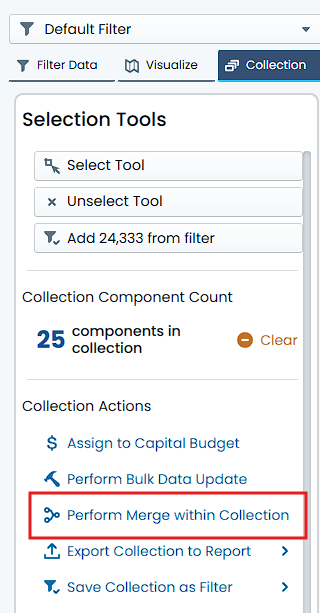
The concept behind collections within the Metrix Asset Management system is to allow users to
choose various components from a map or list, and build an actionable group from them. A collection, in
other words, is a selection set that users can use in system actions.
Once a collection set has been constructed, users can use that collection to:
Perform bulk data updates
Schedule inspections
Generate reports
Create custom filters using the entities in the filter
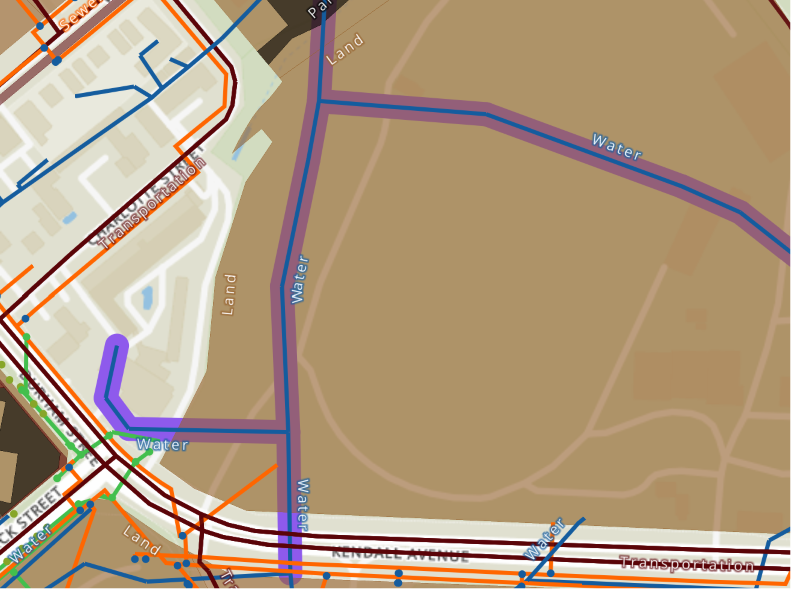
When a component is included in a collection set, the spatial feature will be rendered with a halo, highlighting
it to the user.
As mentioned in the above list, collections can be converted into permanent custom filters. User can also
start a collection from the components resulting from an existing custom filter. There is a two-way
interoperability at play here.
Spatial Features
An elemental facet of the Metrix Asset Management system is spatial representation of asset components. At a basal level,
this is enforced by the mandatory requirement that every component maintained in the system MUST reference a valid spatial
feature. The system has been built around the existence of spatial features, and several tools exist to make this both
beneficial, and easy for end users, including:
Feature sharing across asset components.
Built-in geometry editing tools,
Integration with 3rd party GIS editing platforms such as QGIS,
Attribute updates tied to relative spatial properties, and
Performing asset operations using spatial techniques (line split),
Shared Component Geometries
Each spatial feature in the system is its own record. That is, the geometry is not ‘just’ another attribute of the asset
component. Instead, by maintaining spatial features as distinct entities, we are able to ’link’ a single geometry to
more than one component. This means, you can have the same line feature representing the earthworks, base, and surface
of your road asset. Editing the line once, will update the representation for all.
It should be noted, however, that this sharing feature is not mandatory. Within an asset, each component could have their own
distinct spatial representation. YOu could even maintain a hybrid approach, with two components sharing a geometry, whilst a third
maintains a distinct feature.
The only caveat is that geometries cannot be shared across components with different asset parents. The relationship must stay
within a single asset.
Managing Spatial Features
The system come with built-in spatial editing tools for basic geometry creation and updates. These tools are simple to use
and support all simple geometry types; points, lines, and polygons. In the case that your geometric construction requirements
are more advanced that those offered in system, the Metrix Asset Management system has published a free to access
QGIS plugin that can connect to your cloud environment (using your Metrix account details), view your geometry data, as well as
make edits and save changes back to the system.
Tip
A workflow that many users implement is to initialise an asset its components in system first, and then switch to using the
QGIS plugin to refine and align the new features accordingly.
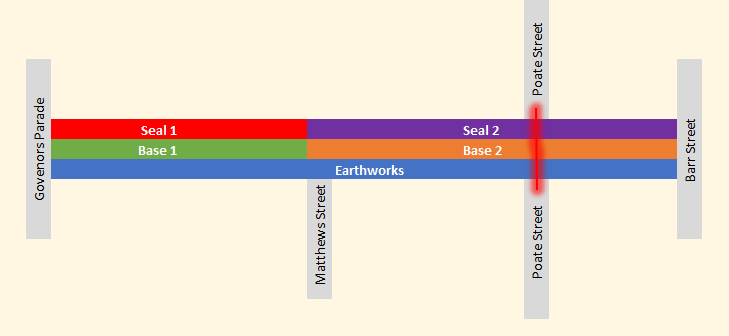
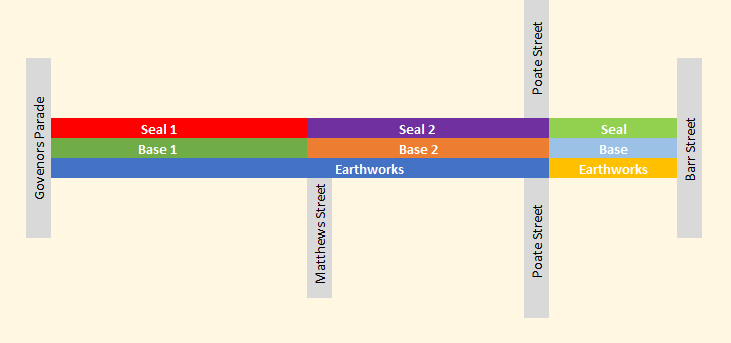
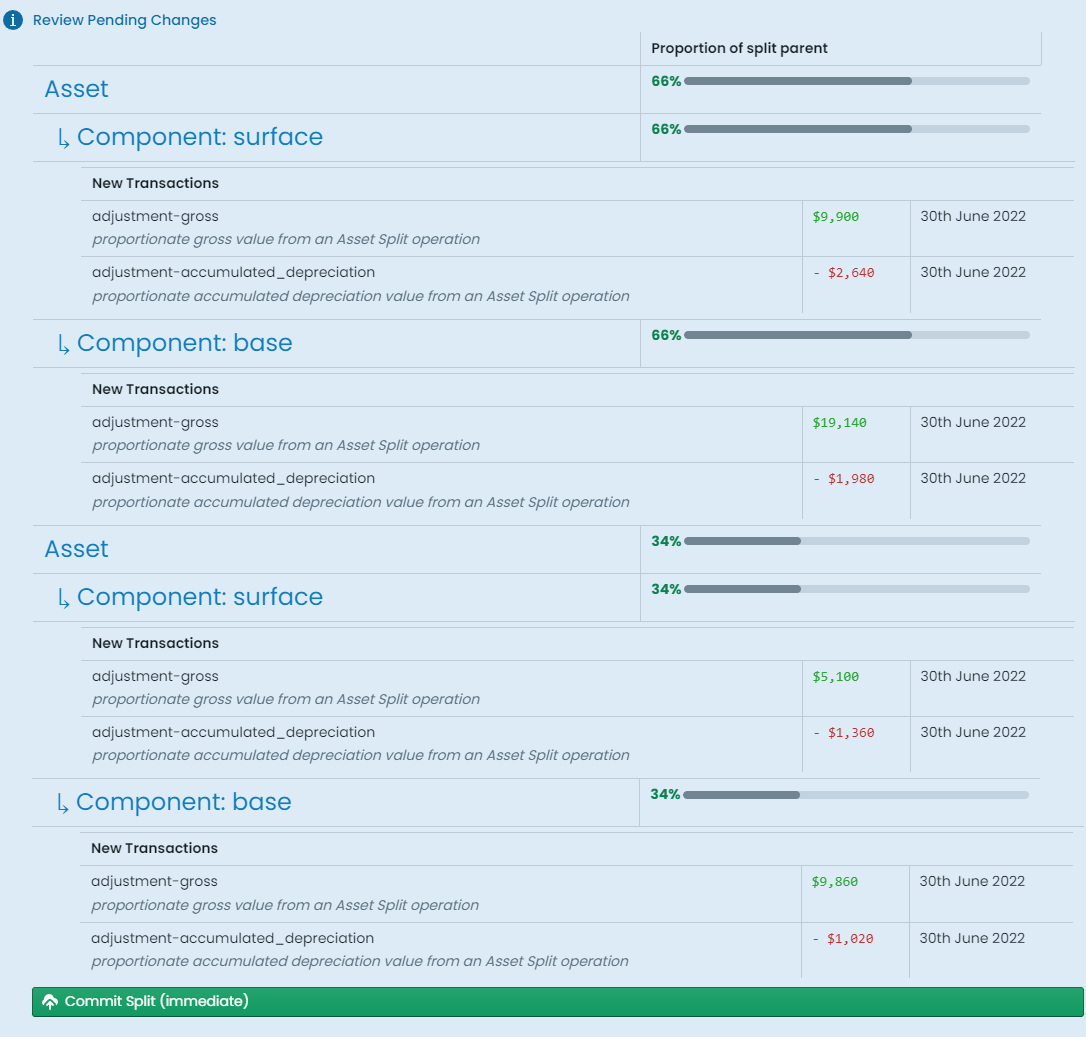
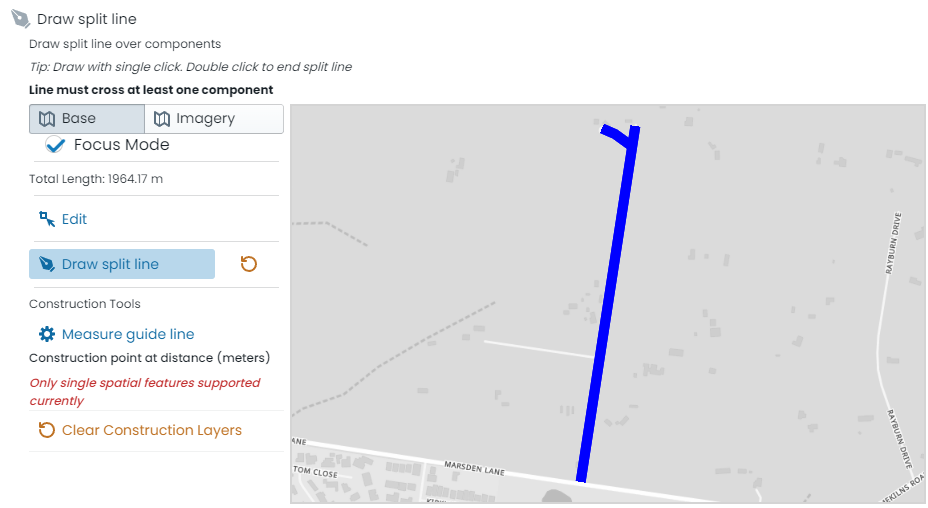
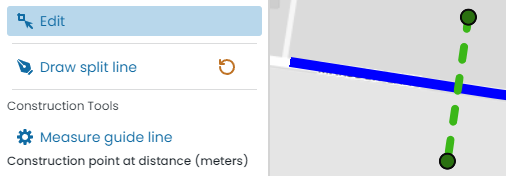
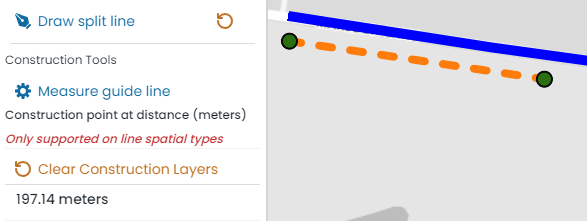
Asset Operations with Spatial Tools (the line splitting tool)
With such a strong relationship to underlying spatial features, the Metrix Asset Management system is able to leverage
geometric principles in offering advanced asset management operations, in an easy to use and understand package. Such an operation
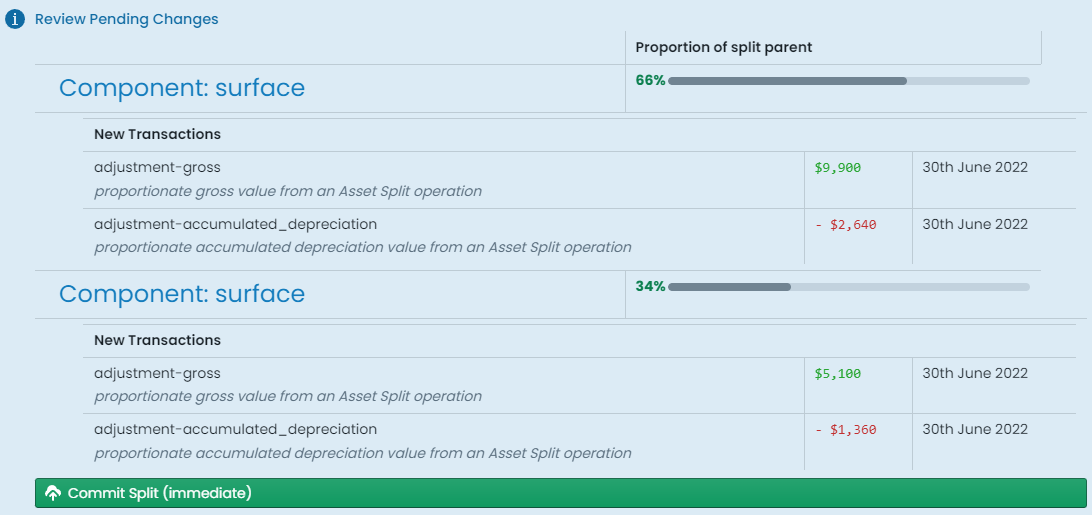
is the ability for users to SPLIT assets or components at a given point with the system handling all the financial apportionment
of capital value for them. This is great for recording partial renewals, re-segmenting your network assets to cater for
additional installations.
Smart Attributes
Another added benefit of mandating spatial features is the ability to leverage spatial properties as attribute information. See
smart attributes for more information.
Residual Life Calculations
In simple terms, the Residual Life is the number of years that a Component has left/remaining before a capital intervention is required. The Residual Life is calculated as the difference between its useful life and the Component’s age plus any residual life offsets (see below) recorded against the Component.
As a Component goes through it’s life, it is expected that it will degrade/age over the years. How any particular Component experiences this ageing process however, will be in accordance with some very local factors relevant to that Component only. This means that any one Component could under-shoot or exceed it’s expected useful life - it also exemplifies how a Component’s useful life is just an averaged expectation, rather than a hard-and-fast rule.
To cater for such variations to lifecycle patterns, the system allows for the Residual Life to be ‘set’ by the user at any point throughout the Component’s life cycle. That is, the user does not modify the useful life of each Component, but rather, can set the residual life to the value they see fit.
This translates to a residual life offset being inferred upon the Component. This residual life offset takes effect upon the calculated residual life by being added to the calculated residual life.
It is for the reasons stated above, that the formula for Residual Life in the Metrix Asset Management system is:
$$ [UsefulLife] - [Age] + [ResidualLifeOffset] $$
Info
It is important to remember however, a Component will NOT start ageing until it reaches it’s Initial Capital Anniversary date. By default, this is 30 June and is listed in the ‘Intervention Statistics’ section of the Component info panel.
Further to this, it is important to note that adjustments to a Component’s Residual Life only begin taking effect once the Initial Capital Anniversary date has passed. This is simply because, as mentioned above, the Component does not commence ‘ageing’ until it passes this date.
Inputs to Residual Life
The following provides additional details on the inputs to the residual life formula discussed above.
Residual Life Offset
A component’s residual life offset is an offset applied to the calculated ‘residual life’, to either increase or decrease the resulting value. The residual life offset is calculated by the Metrix Asset Management system as the difference between the calculated ‘residual life’ and the subjectively assessed remaining life. That is:
Consider the road surface component of a road Asset that has a useful life of 15 years. Now consider that the age of the Component is 10 years. This means that the residual life (using the formula above) is:
Note: at this point in time, the component has NO residual life offset, thus we add zero.
Now assume that at this time, when the component is 10 years old, it is assessed and deemed to actually have 6 years of life left. The system calculates the residual life offset (using the formula above) to be:
There is NO requirement of a user to consider the concept of residual life offset when altering the residual life of a component. In fact, a user can be safely ignorant of the concepts of residual life offset. All the user needs to supply (going by the above example) is that the residual life of the component should be 6, not 5. The system will take that value and calculate the +1 years offset in the backend.
If the user were to state that the residual life was actually 8, then the system would calculate an offset of +3 years.
As the residual life offset is applied to the residual life value after the initial basic residual life calculation takes place, the reported residual life will continue to decrease as time passes. The user does not need to do anything for this, the system will handle it all.
Capital Anniversary Dates
A Capital Anniversary date is a pre-ordained time of the fiscal year when a capital asset undergoes an ageing event. By default, Metrix environments are configured for annual (once per year) capitalisation. - however, this can be adjusted to suit the needs of the organisation to frequencies such as quarterly, monthly, or the like.
When a Component is first built, or renewed, it will receive a construction date and/or a last intervention date. The Capital Anniversary event relevant to this date is:
the Initial Capital Anniversary. This is the date in which the Component will BEGIN ageing.
Throughout the Component’s life, two other Capital Anniversary events are continuously relevant to the Component - the Most Recent Capital Anniversary and the Next Capital Anniversary:
the Most Recent Capital Anniversary is the most recent date in which the Component underwent an ageing event, and
the Next Capital Anniversary is the next date in which the Component is scheduled to undergo a capitalisation event.
All of the above Capital Anniversary dates are listed in the ‘Intervention Summary’ section of the Component info panel.
Age
A component’s age is calculated as the difference between the first ‘capital anniversary’ that occurred after the component’s intervention date, and the most recent ‘capital anniversary’ to have passed.
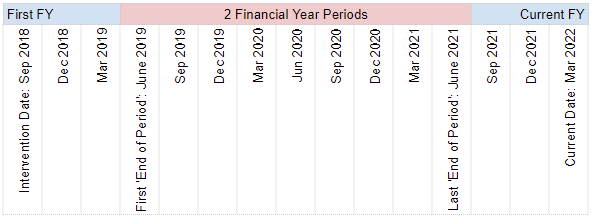
Example
Consider a Component whose last intervention date was 1 September 2018. Also, assume that the current date is 1 March 2022. The component first starts ageing on 30 June 2019 (the first ‘capital anniversary’ following its intervention date), and the last ageing anniversary for the component is 30 June 2021 (the most recent ‘capital anniversary’ to have passed). The Component is therefore 2 years old.
Reports generated from the system support returning the age of a component at a date other than the current date. A report generated at a date of 2 years in the past, will return the age of the component at that date - not today.
Last Intervention Date
The last intervention date refers to the date in which a component last underwent capital intervention works relating to it’s treatment. This includes:
the original_construction_date of the component,
the date of major renewal works on the component, or
the date of substantial upgrade works on the component.
Example
Consider the road surface for a brand new road Asset. After it is first built and commissioned, the Last Intervention Date will be equal to the ‘original_construction_date’. Years later, the road surface will require a reseal treatment. After this reseal (a major renewal intervention), the last intervention date will be the date that this reseal occurred.
The original_construction_date will NOT change following an intervention (i.e. a reseal for a road surface). Only the last intervention date will change over the course of a component’s lifetime.
Component Quantity/Size
The quantity/size of a component in the Metrix Asset Management system
is stored within the ‘Cost Units’ value, in the ‘Intervention’ info panel. Given that
component shapes and measurement techniques differ from type to type, and the method
of ascribing a cost to that shape/technique is variable, the cost units value of a
component is not restricted to a specific component metric such as length, area,
volume, etc. Rather, the cost units number field is free to represent whatever quantity
that is required to satisfy the assigned intervention treatment.
Info
The cost method merely controls the calculation configuration for replacement cost.
To perform the calculation, the treatment must have an assigned Unit Rate relative
to the cost method. Also, the Component must have a valid ‘Cost Units’ multiplier -
in the correct Unit of Measure defined by the treatment - for that Unit Rate.
Metrix also supports the implementation of cost unit formulas to automatically
calculate these values based off the value of certain metric fields. This is covered
in another section pertaining to
Smart Attributes and
Cost Unit Formulas.
Example
Consider the road surface component of a road Asset. The treatment associated with the component is called ‘14/7mm Initial Seal’ and has the following properties:
Units of Measure: Square Metres
Cost Method: Unit Rate
Unit Rate: $3.25
Default Useful Life: 15 years
From this, we can determine that the component’s cost units are measured in ‘Square Metres’ and, given the ‘Cost Method’ is ‘Unit Rate’, the replacement cost will be calculated by multiplying the ‘Unit Rate’ by the ‘Cost Units’.
Given that the road surface is 1200 sq.m, the cost units for the Component is 1200.
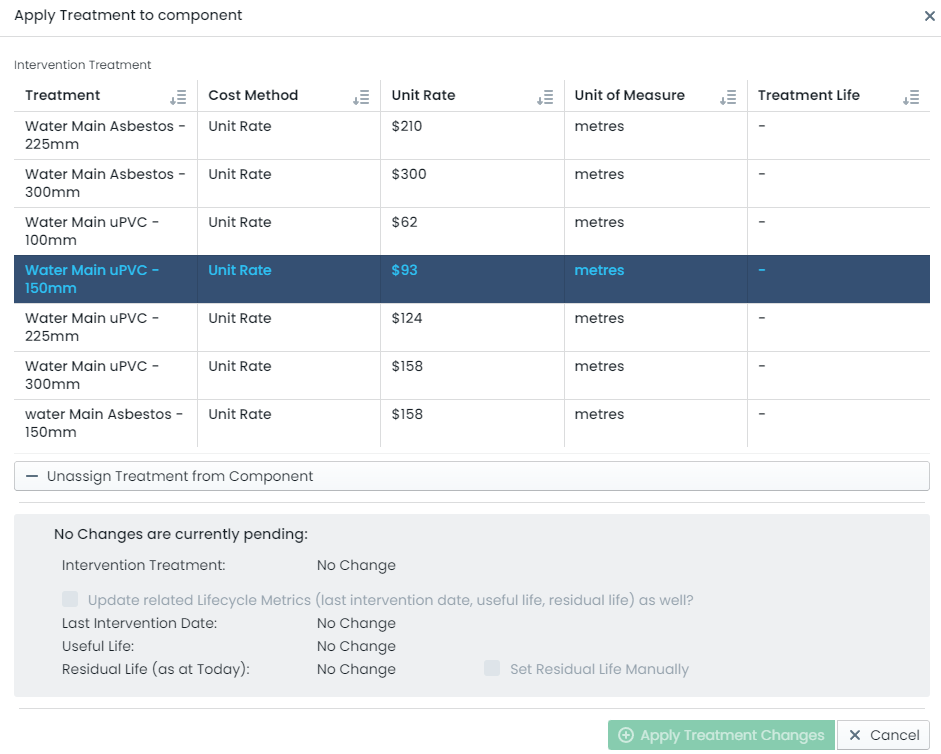
Component Treatments & Next Treatment
Intervention Treatments in the Metrix Asset Management System
provide the ability for users to store and manage unit rates and default
useful lives for a variety of component interventions. When
assigned
to a component group, treatment definitions are able to be used to define the
current and/or next intervention method for given components.
Component Treatment
The current component treatment informs a component ‘Unit Rate’ (for current cost calculations),
the ‘Default Useful Life’, as well as an indicator to the material and/or methodology used in
it’s original construction. The later of these depends on the naming conventions used in
defining
intervention treatments.
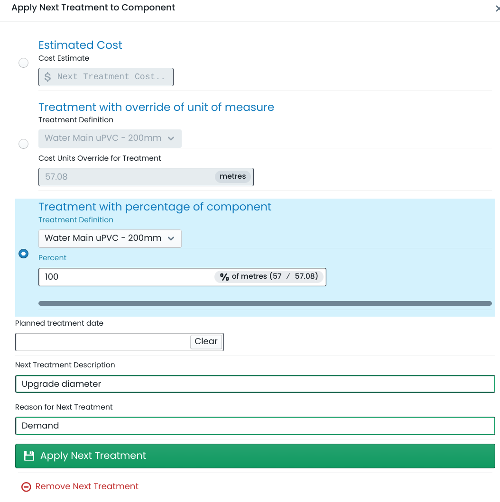
Next Treatment
A component’s next treatment definition allows for users to record their ‘best guess’ how a component’s
upcoming intervention treatment will be conducted. Such definitions can be based on:
Estimated Cost: for works that may be based around an externally quoted price.
Treatment with Override Unit of Measure: for works that will be conducted in accordance with a chosen
treatment definition - but for a specific quantity of
cost units.
Treatment with Percentage of Component: for works that will be conducted in accordance with a chosen
treatment definition - but for a percentage share of the component’s current cost units.
Financial Movements
The financial transactions ledger within the Metrix Asset Management system tracks the financial
consumption and restoration of asset components over their lifetime. This data is then collated in a
number of system reports that satisfy the financial reporting obligations of user organisations. The
following outlines a number of terms used throughout the system, and how they tie into the financial
frameworks in force.
Gross Value
The replacement cost of a component at the time of valuation (or revaluation). Gross value can increase
or decrease over the life of a component through intervention actions such as additions or upgrades to
the asset component. Another way that gross value increases or decreases is through indexation – this is
essentially increasing the value of a component by a percentage amount, typically in line with CPI.
Accumulated Depreciation Value
The accumulated depreciation of a component is the sum of all depreciation transactions logged against
it over its life time.
The formula for accumulated depreciation is:
$$ \sum [Depreciation Charges] $$
In the Metrix Asset Management system, the accumulated depreciation is posted as a NEGATIVE NUMBER
to reflect the fact that it is a ‘consuming’ factor.
Example
Consider a road surface Component for a road Asset. The initial gross value for the component is $123,000.
Each year, the component incurs a depreciation charge of -$8,200. After 5 financial year periods (assuming
no other depreciation events occur) the accumulated deprecation would be:
The carrying value of a component is the net worth of the component to the entity in adjusted terms. Carrying
value is a calculated value that deducts the accumulated depreciation from the gross value. Given that the
depreciation figure is already stored within the Metrix Asset Management system as a negative figure however,
the formula for carrying value is:
$$ [Gross Value] + \sum [Depreciation Charges] $$
Example
Consider again, the road surface component from the previous example. The accumulated deprecation is calculated
to be -$41,000
The carrying value** for the component after this 5 years period is therefore:
$$ $123,000 + (-$41,000) = $82,000 $$
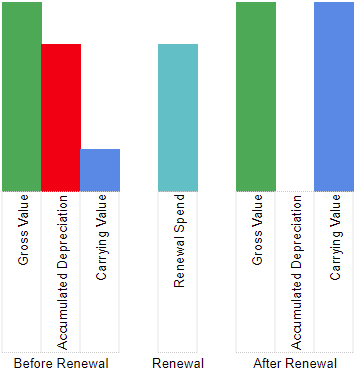
Renewals and Depreciation
In the Metrix Asset Management system, a renewal expenditure is typically posted as a POSITIVE movement against the components
accumulated depreciation. This is to recognise the fact that the action has ‘undone’ the financial consumptions
of the past. In turn, the components carrying value (assuming renewal costs equal gross value and a fully
depreciated component) is restored to its original gross value as expected.
How To Guides
This section provides user guides on some of the basic elements of the Metrix Asset Management
system including:
This guide provides an overview on how to make asset component selections from a map view
withing the Metrix Asset Management system, including:
Selecting from the Map
When you wish to get information about an asset and/or component in your current map view,
simply click on the spatial feature.
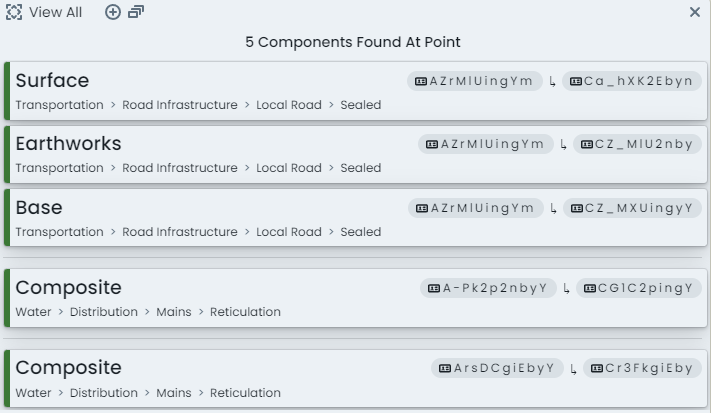
On the right-hand side of the window, an info panel will appear. If the area you clicked on
contains more than one (1) valid asset component, you will be presented with the option to
refine your selection down to the target component you want information about.
As seen above, each asset (falling in the range of your click location) will be grouped and
the sub-components displayed for your choice. Click on the asset/component you wish to
view.
The component info panel will then render for your chosen component.
Info
If the location of your mouse click only intersected one (1) component, you will be taken straight
to this panel.
Changing Component Groups within an Asset
When viewing information about a selected component, you can switch to another component on the
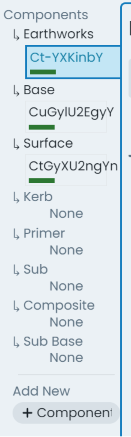
same asset using the ‘Components’ switcher on the left-hand side of the info panel.
Each available component group (on the asset classification configuration) will be rendered in this
side panel. If the asset has one or more component entries against a particular component group,
a component ID and status tag will be shown. Otherwise, it will state, ‘None’.
To view the information about one of the listed components in this list, simply click on that entry in
this panel.
Changing Info Panel Display
To view different information about the selected component, users can simply switch between the
tabs across the top of the info panel.
Info
The ‘Parent Asset’ tab contains asset level information and is therefore identical no matter what
component within the asset you are viewing.
Using Custom Filters
This document provides an overview on how to filter your asset portfolio using the built-in
custom filter tools, including:
Filtering Data
To get started using custom filters, navigate to the main ‘Assets’ map in the Metrix Asset Management
system.
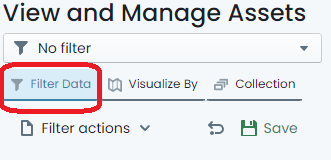
On the left hand side of the page, make sure the ‘Filter Data’ tab is activated.
Here, you will see a number of categories that can be used to filter the visible asset components in the
map view.
Note: If there is a current filter applied, clear it by following
these
steps.
Choose any category to begin your filter by clicking on the ‘filter pod’ for that category. For example: Click
on ‘Condition’.
A menu fly-out will appear where you can then further define how you wish to apply the filter using the chosen
category. These will typically be represented by checkboxes for restrictions to apply to your portfolio. For example:
For condition, you may tick ‘Excellent’. This would restrict the visible asset portfolio to components with
a Condition value of ‘Excellent’.
Filter conditions can be chained together. Click on another ‘filter pod’ and set some additional restrictions. For
example: Click on ‘Residual Life Years’. The fly-out requests that you input two (2) values:
a. The operator (<, >, =), and
b. The value relative to the operator.
Inputting > 6 would restrict the visible components to those with more than 6 years of residual life remaining.
To remove a specific filter definition, simply uncheck the restriction within that category. For value based filter
settings, there is a ‘Reset’ option within the menu fly-out.
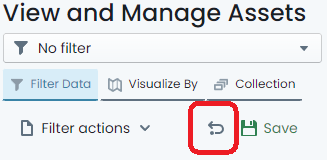
Clear the Filter
To clear an active filter, simply click the ‘return’ icon at the top of the filter panel. This will remove all
of your configured filter settings.
Note: This does not affect the settings of ‘Saved’ filters, but will clear the filter from being active.
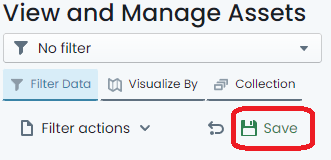
Saving/Sharing a Filter Definition
The system supports the saving and sharing of filters. To do so, define your filter following the steps above.
Once you have finished configuring the filter properties, simply click on the ‘Save’ option at the top of
the filter panel.
A fly-out menu will appear prompting you for a name for the new filter. Input a name for the filter (this is how
you will find it later).
To opt to allow other system users to see the filter you have defined, toggle the ‘Shared’ control. By default,
filters are private and NOT shared.
When you are done, click ‘Save’. The filter is now saved under that name. If you shared the filter, other users will
see it in the ‘Filter Drop-Down’ at the top of the panel.
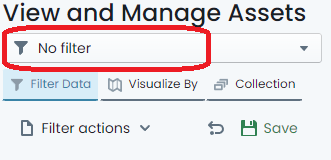
Using Save Filters
To use a predefined filter that you have saved, or another user has saved and shared, simply expand the drop-down menu
at the top of the filter panel.
Here you will find a list of filters that can be applied. If you already have a saved filter applied, it will be highlighted
in this menu.
To stop using the filter, either clear
it, or select ‘No Filter’ from the ‘Filter Drop-Down’.
Info
The ‘Filter Drop-Down’ menu also contains a section for filters that were defined using a collection set. These can be accessed
from the ‘Collection’ tab of the menu. More information on saving collection sets as filters can be found
here.
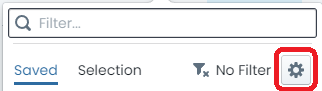
Deleting a Saved Filter Definition
At any time, the user who created a custom filter, can delete that custom filter definition. This includes shared filters.
To delete a saved filter, click on the ‘Settings’ cog in the ‘Filter Drop-Down’ menu.
A dialog detailing each saved filter available to the user will then be displayed. Next to each of the filters in the table,
is a button to ‘Delete’ the filter from the system. Click this button to delete the filter.
Info
If the ‘Delete’ button is not visible, or deactivated, it means that you do not own the filter.
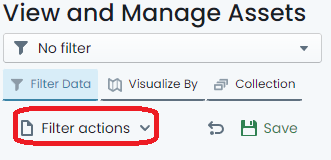
Filter Actions
The ‘Filter’ panel also contains short-cuts to a few reports that can be generated using the current filter definition
as a filter.
To use these action short-cuts, simply click on the ‘Filter actions’ menu at the top of the filter panel.
From the menu, choose which report you would like to generate.
Info
The filter does NOT have to be saved in order to generate a report in this fashion.
Using Map Themes (Visualisations)
This document provides an overview on how to use the built-in custom map themes in the Metrix Asset
Management system.
Note
The Metrix Asset Management system controls spatial features at a component level. When
viewing some map themes, there may be overlapping shapes caused by stacked geometries of multiple asset components.
This can cause obscuration and/or blending of the rendered colours.
In these cases, it is advisable to filter your data to a specific component group.
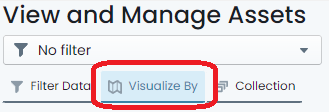
To get started, navigate to the main ‘Assets’ map in the Metrix Asset Management system.
On the left hand side of the page, make sure the ‘Visualise By’ tab is activated.
.
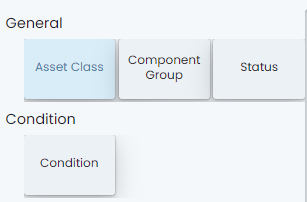
Initially, you will see a map legend for the currently applied map theme. By default, this is
set to colour switch on ‘Asset Class’. To change the map theme to a different pre-configured
visualisation, simply click ‘Switch Map Theme’ at the top of the panel.
This will now display all of the available built-in map themes in a range of contextual categories.
.
To apply a specific visualisation, simply click on the tile in this view.
The theme will apply, and you will be returned to the ‘Legend View’ as it pertains to your
chosen theme.
Repeat this process to go to another theme.
Info
Remember, the default map theme is called ‘Asset Class’. Choosing this theme will essentially
reset your visualisations to system standard.
Component Change History
This document provides an overview on how to use the Component Change History Viewing tool in the Metrix
Asset Management system.
To get started, navigate to the main ‘Assets’ map in the Metrix Asset Management system and
select an asset record to
bring up it’s Info Panel.
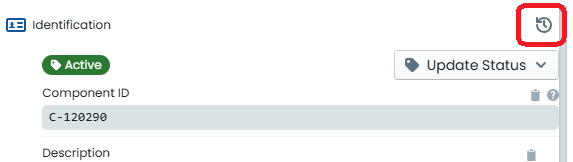
Ensure you have either the ‘Info’ or ‘Intervention’ panel tab open, and look for the ‘History’ icon
along the right-hand side edge of the panel. A ‘History’ icon is available at the top of each ‘section’
of Info Panel content.
.
A slide-out drawer will appear, initially with the Component’s current information listed. Only sections
where history is tracked, are shown.
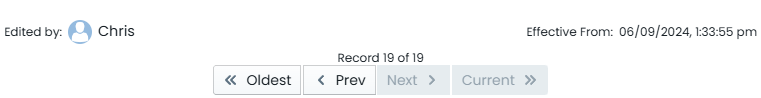
At the bottom of the slide-out drawer, you will see some navigation buttons. These allow you to move
backwards and forwards through the change history of the active component. Additionally, around these navigation
buttons, you will see the date and time of the change, as well as the name of user who made the change.
.
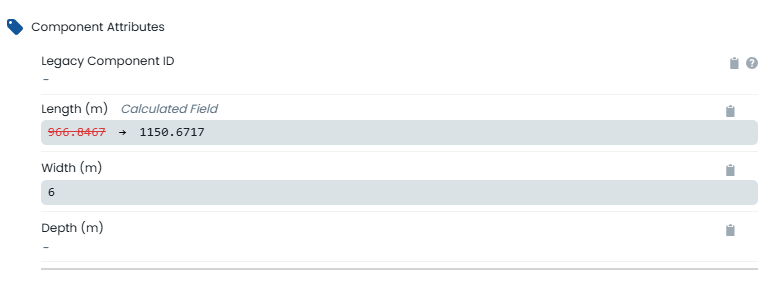
Any differences that exist between the record version you are CURRENTLY VIEWING and the LIVE VERSION of the
component record will be highlighted in red. In the example below, the current (live) value of the component’s
length is 966.8467, whereas the historic value of this field value is 1150.6717.
.
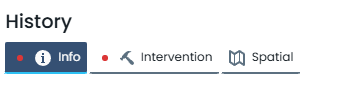
Additional indicators exist on each tab to guide users towards areas where changes exist on the current component
version. These indicators are shown as a red dot next to the tab label. In the example below, the ‘Info’ and
the ‘Intervention’ tabs contain changes, whereas the ‘Spatial’ tab does not.
.
Building Collection Sets
This document provides an overview on how to use the collection set concept in the Metrix Asset
Management system, including:
Defining a Collection Set
To get started, navigate to the main ‘Assets’ map in the Metrix Asset Management system.
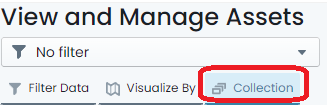
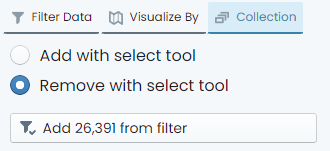
On the left hand side of the page, make sure the ‘Collection’ tab is activated.
To start building your collection set, click the ‘Add with select tool’ option at the top of the
panel. This will place you in ‘Selection’ mode where any clicked assets in the map view will
add those asset components to your collection set.
Info
The selection tool will add ALL components from a clicked asset. It does, however, respect any applied
custom filters that may be excluding some component types. That is, if you filter out road base and
road earthworks (leaving just surface), and click on a road segment, only the surface will be
added to your collection. Without a filter, all three (3) component groups will be added.
Once you have added some asset components to your collection, the ‘Remove with select tool’ option
will activate as an optional mode. Using this mode will mean that every asset clicked on will
REMOVE its components from your collection set (if they were a part of it).
Also, you have the option of simply adding ALL components from your current custom filter definition
to your collection set. That is, if you have a filter that results in 15 components, then those
15 components would be added to your collection set.
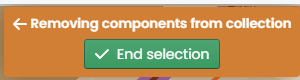
Once you have finished defining your collection set, click the ‘End selection’ option which will be
hovering at the top of the map window.
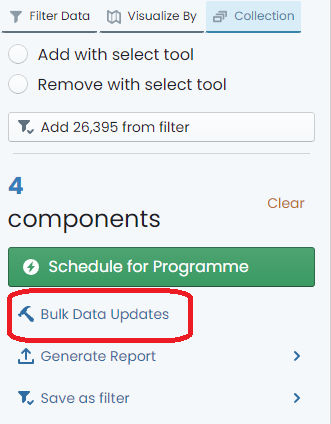
Collection Set Actions
Once you have a defined collection set, you can then perform actions on it including
bulk data updates and generating reports.
To generate a report from the current collection set, simply click ‘Generate Report’ from the
‘Collection Panel’ and choose the report you would like to create. The results of the report
will be filtered down to your current collection set.
Info
Other available collection actions are subject to their own instructions.
Saving Collection Set as Filter
Once you have finished building the collection, simply click on the ‘Save as filter’ option in
the ‘Collection Panel’.
A fly-out menu will appear prompting you for a name for the new filter. Input a name for the filter (this is how
you will find it later).
To opt to allow other system users to see the filter you have defined, toggle the ‘Shared’ control. By default,
filters are private and NOT shared.
When you are done, click ‘Save’. The filter is now saved under that name. If you shared the filter, other users will
see it in the ‘Filter Drop-Down’ at the top of the panel.
Info
Filters created from Collections will be listed under the ‘Collection’ tab of the ‘Filter Drop-Down’ list.
Editing Data
This section provides guidance on how to maintain your asset and component data in the Metrix
Asset Management system. Including:
Basic Data Edits
Save or Discard Changes
Create/Edit Task Type Definition
Reshape/Replace Component Geometry
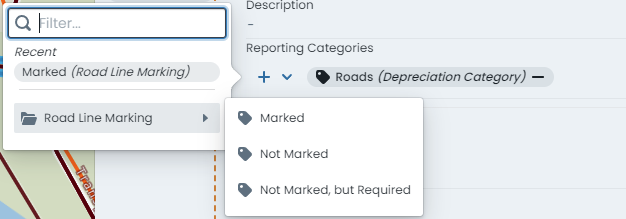
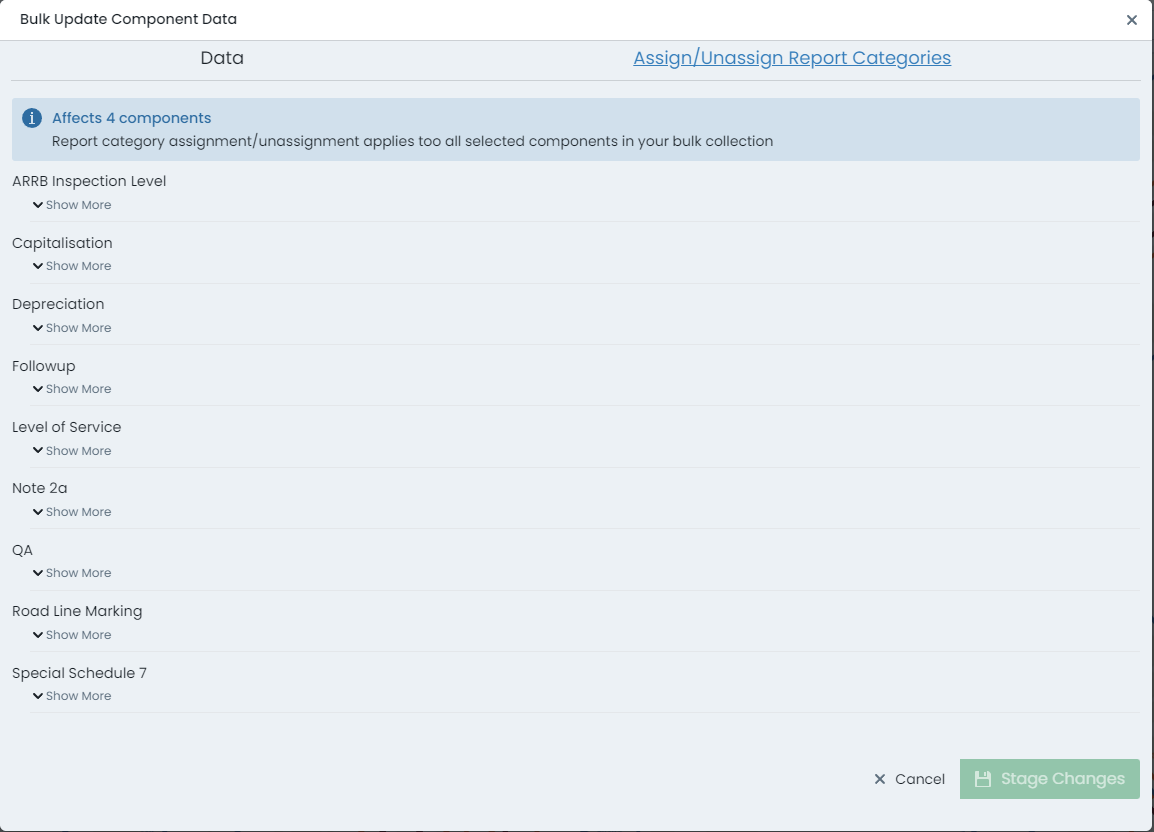
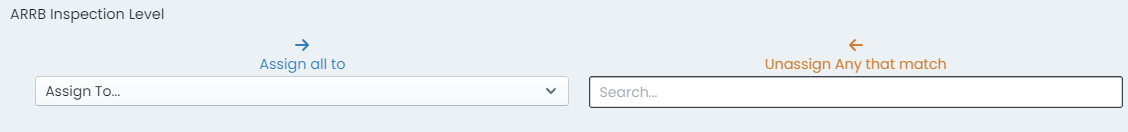
Assign/Unassign Report Categories (Tags)
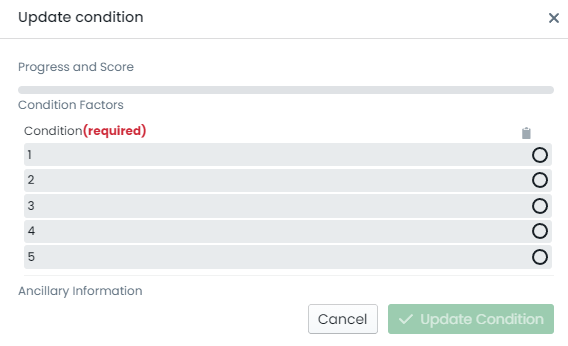
Update Condition
Update Treatment
Update Next Treatment
Bulk Updates of Collection Sets
Financial Settings per Component
Post Transactions
Delete Transaction(s)
Subsections of Editing Data
About
This section provides an overview of the two-step saving process implemented in the Metrix
Asset Management system.
Subsections of About
Staged Changes
Making edits to your asset information in the Metrix Asset Management system is a two-phased
process. First, you make the alterations. Then, you save those changes (or discard them). Prior to this
second step, the changes are considered to be STAGED, and awaiting final SAVE.
Users can make many edits in a single sessions before opting to save or discard the staged changes.
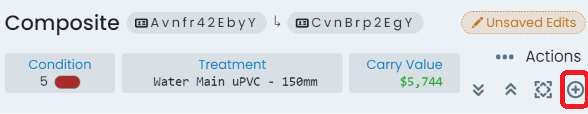
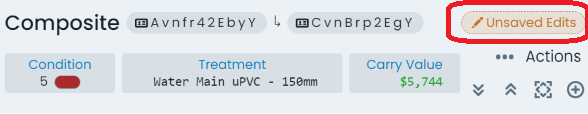
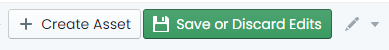
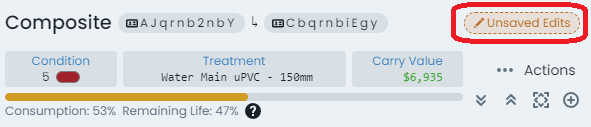
After your first alteration, you will notice that the ‘Save or Discard Edits’ button in the top-right
hand corner of the page is now activated. Additionally, there is an orange marker line surrounding the
info panel for the asset/component that the changes occurred on.
Prior to saving changes, users are provided the chance to review their work via a summary of the changes
panel.
How To Guides
This section provides guidance on how to maintain your asset and component data in the Metrix
Asset Management system. Including:
With appropriate user rights, editing your asset information in the Metrix Asset Management system
has been tailored to be super simple, and safe. To get started with editing your asset information,
follow these steps:
Navigate to the main ‘Assets’ page and make a
selection
from the map screen.
Your asset and component data is displayed inside the info panel on the right-hand side of the
page. This is where you will also edit the data.
To edit a field, simply click the information content - if the field is editable, and you have the
appropriate privileges, the content will transform into an editable control. Depending on the field,
users will be presented with one of the following controls:
Instructions on how to use each of the above controls are discussed below.
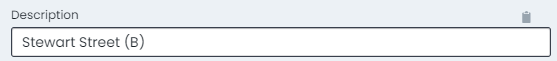
Text Input Box
For alpha-numeric free text fields, the control that renders when you set it to edit mode will be
a standard input box.
To edit content in an input box, simply locate your cursor and begin typing.
Once you have finished making your edits, click anywhere outside of the box to release the control.
The edits you made are now STAGED and ready to save.
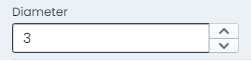
Number Input Box
For numeric data fields, the control that renders when you set it to edit mode will be a standard number input/picker box.
To edit content in an input box, simply locate your cursor and begin typing.
Another option you have is to click the increase/decrease toggles on the right-hand side of the input box.
Once you have finished making your edits, click anywhere outside of the box to release the control.
The edits you made are now STAGED and ready to save.
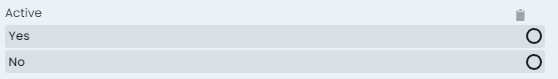
Option Row
For list based data fields that have fewer than 5 options, the control that renders when you set it to edit mode will be an option row.
To alter or set the active choice in the option row, simply click that option.
The edits you made are now STAGED and ready to save.
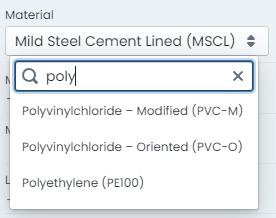
Drop Down List
For list based data fields that have more than 5 options, the control that renders when you set it to edit mode will be an drop-down list.
To alter or set the active choice in the option row, simply choose that option from the list.
The drop down list control also supports filtering of the visible list items. To do this, simply type your filtering letters into the
search box at the top of the list.
The edits you made are now STAGED and ready to save.
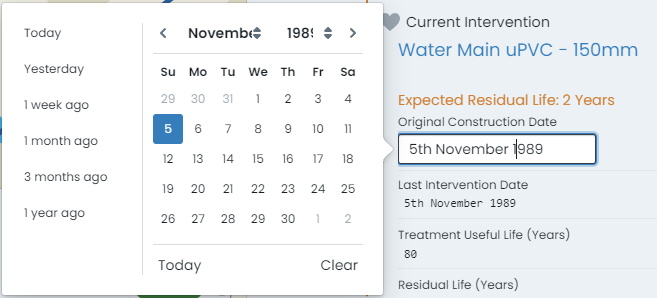
Calendar Picker
For date based data fields, the control that renders when you set it to edit mode will be a dynamic calendar control.
To edit content in a calendar control, simply choose the date value from the displayed calendar widget.
The calendar is month based. Users can change the visible month and year using the drop down options at the top of the control.
Some calendar controls are also pre-configured with ‘quick-dates’ allowing you to set the value to date such as ‘1 week ago’.
The edits you made are now STAGED and ready to save.
Save or Discard Changes
Making edits to your asset information in the Metrix Asset Management system is a two-phased
process. First, you make the alterations. Then, you save those changes (or discard them). The following
outlines how you can do this.
This document provides guidance on saving changes, as well as some other options around saving or discarding
your changes, including.
For each of the following sections, we assume you have one or more pending changes to your asset information.
If not, make some edits
to your asset and/or component information.
Info
It should be noted that users can make many edits in a single sessions before opting to save or discard
those changes.
Give it a try.
After your first alteration, you will notice that the ‘Save or Discard Edits’ button in the top-right
hand corner of the page is now activated. Additionally, there is an orange marker line surrounding the
info panel for the asset/component that the changes occurred on.
Saving Changes
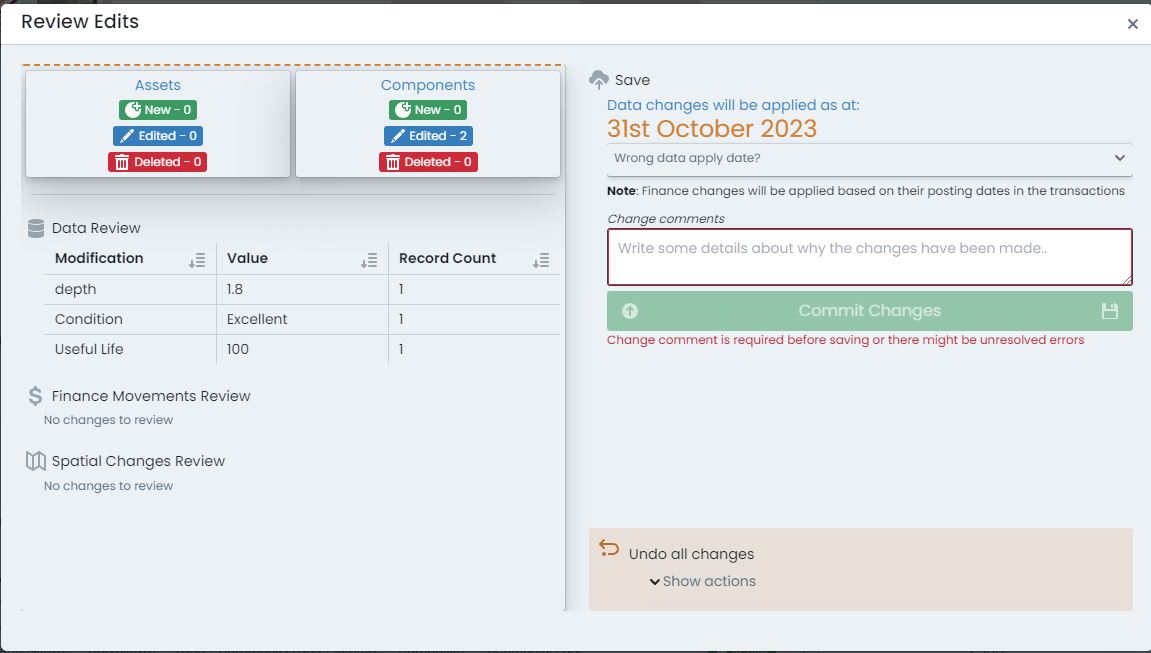
Start by reviewing your change(s), click on the ‘Save or Discard Edits’ button. A dialog will appear with a
summary of the changes you have made to your asset and/or component data.
Alterations are broken down by type, and summarised into affected record counts.
To commit the changes, provide a short comment about the alteration, and then click ‘Commit Changes’.
The data will then be permanently saved to your Metrix Asset Management system.
Saving Changes at a Specific Date
The Metrix Asset Management system maintains a full audit history of changes users make in the
system. This audit history is available through the ‘Report’ generators - allowing a user to backdate
certain reports, to get asset/component information as it was at a specific point in time.
To extend upon this capacity, the system also supports backdating the ‘Effective Date’ of an alteration
so that it can be visible in specific reporting ranges.
Example
A common use case for this feature is logging updated CONDITION values for components that were renewed during
a specific financial period - but only being recorded after said period has passed.
For example, updating condition values during your ‘End of Year’ process in August, to affect information in June.
Start by reviewing your change(s) - click on the ‘Save or Discard Edits’ button. A dialog will appear with a
summary of the changes you have made to your asset and/or component data.
Alterations are broken down by type, and summarised into affected record counts.
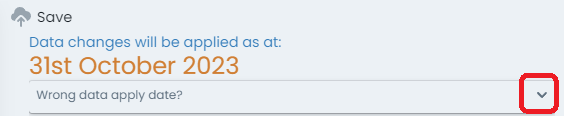
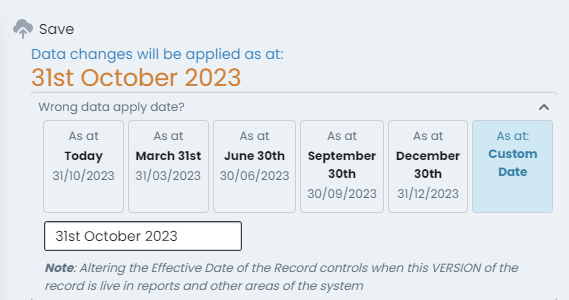
To set a specific ‘Effective Date’ for the alterations summarised, expand the panel below the current date (which
is rendered at the top of this dialog).
The expanded panel provides options to override the ‘Effective Date’ with shortcut values, or a custom date entry.
Make your selection for ‘when’ the change(s) should be applied.
The data will then be permanently saved to your Metrix Asset Management system, effective from the date you
specify.
Discarding ALL Changes
Start by reviewing your change(s), click on the ‘Save or Discard Edits’ button. A dialog will appear with a
summary of the changes you have made to your asset and/or component data.
Alterations are broken down by type, and summarised into affected record counts.
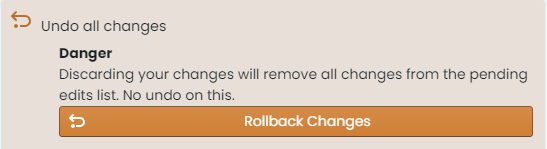
On the bottom left-hand side of the dialog portal, a collapse panel is rendered offering you the
option to ‘Undo all Changes’. Click on this panel.
The panel will expand, revealing an option to ‘Rollback Changes’. To continue with undoing any
alterations you have made since your last save, click this button.
Any alterations you have made will be reverted, and your session restored.
Discarding Specific Component Alterations
At any time during an editing session, users can review what information has changed on a specific
asset or component from right within the info panel. In the top right-hand corner of the info
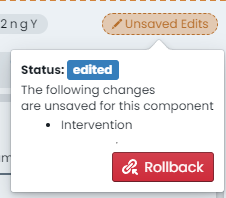
panel is an ‘Edits Indicator’ that appears when the active asset/component has pending edits against
it.
Click on this indicator to see a brief summary of the changes.
To rollback all changes recorded against the active component, click on the ‘Rollback’ button inside
this preview.
Note
This option only relates to COMPONENT data edits. It cannot be used to revert alterations made on the parent
asset info panel.
Task Types
This guide provides an overview on how to create or edit task records in the
Metrix Asset Management system. The areas covered include:
Info
It should be noted that, in order to use a specific task type, it must be assigned
to the classification.
Viewing Task Records
Any task records that have been captured, will be displayed in the parent asset info panel (for records
logged at an asset level), or the component info panel (for records logged against a specific component). To see the records,
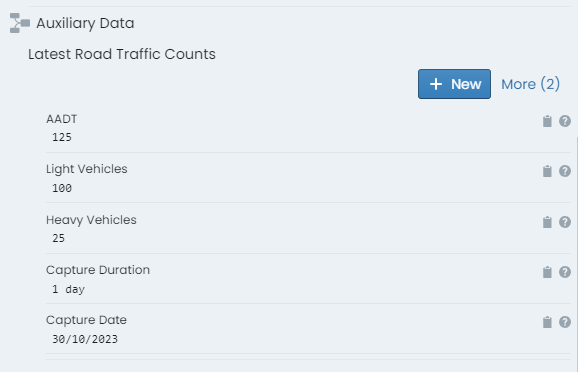
scroll to the bottom of the respective info panel, to the section titled ‘Task Data’.
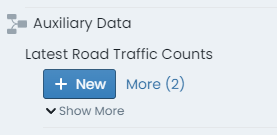
The most recent entry will be displayed in a form layout. In the top right-hand corner of the form is an indicator (titled ‘More’)
regarding how many records of that task type exist against the asset or component. Click this label to see more records.
The form view will expand at this point to a form view per task record, stacked and ordered by record date. Scroll this view to
see the details of each entry.
Enter a New Task Record
To capture a new task data record, navigate to the relevant info panel. That is, to capture a record against the
asset, go to the parent asset info panel. To capture a record against a specific asset component, go to that component info panel.
Scroll to the bottom of the info panel to where the task records are rendered.
Info
If no task types are assigned to the appropriate classification level, this section will simply state ‘No task types configured’.
If more than one task type is assigned, they will each be listed in this section.
For the relevant task type definition, click on the ‘New’ button.
A fly-out panel will appear with the task form rendered in edit mode. Complete this form.
When you are finished, simply click ‘OK’ at the bottom of the form. To cancel, click the ‘X’ in the top right-hand
corner of the form.
The new task record entry is now STAGED and ready to save.
Edit a Task Record
To edit an existing task data record, simply navigate to the record in the appropriate info panel. That is, for a record
logged against an asset, go to the parent asset info panel. For a record logged against specific asset component, go to that component info
panel.
Scroll to the bottom of the info panel to where the task records are rendered.
For the task type you are altering, click the ‘More’ option to expand the entries.
Each record entry rendered for the task definition will have an ‘Edit’ button at the top of it. Click this button.
A fly-out panel will appear with the task form rendered in edit mode. Update this form.
When you are finished, simply click ‘OK’ at the bottom of the form. To cancel, click the ‘X’ in the top right-hand
corner of the form.
The modified task record entry is now STAGED and ready to save.
Delete a Task Record
To delete an existing task data record, simply navigate to the record in the appropriate info panel. That is, for a record
logged against an asset, go to the parent asset info panel. For a record logged against specific asset component, go to that component info
panel.
Scroll to the bottom of the info panel to where the task data records are rendered.
For the task type you are altering, click the ‘More’ option to expand the entries.
Each record entry rendered for the task type definition will have an ‘Actions’ button at the top of it. Click this button.
In the menu that flies out from this button, there will be a ‘Delete’ option. Click this option.
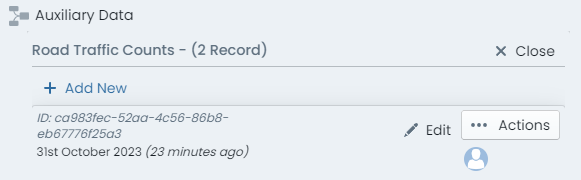
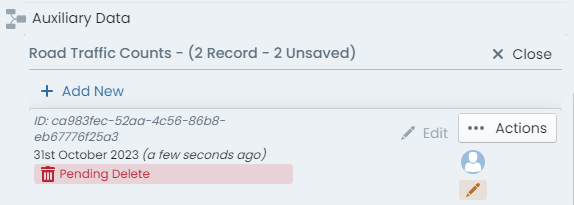
The task record entry is now STAGED for deletion. Simply save
your changes for this to take effect.
Reshape/Replace Component Geometry
This section provides an overview on how to manage your spatial features within the Metrix Asset Management
system. The context covered includes:
Important
Spatial features can be shared by more than one component. Remember to check if the feature you are modifying is
shared
and if this has any effect on you doing so.
Reshaping an existing Component Spatial Feature
To alter the spatial feature of a component, select the asset and navigate to the appropriate component info panel.
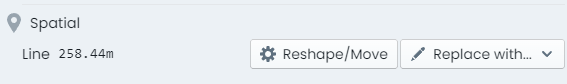
Within the component info panel, is a section titled ‘Spatial’. To modify the current geometry without changing the
geometry type (point, line, polygon), click ‘Reshape/Move’.
The info panel will hide itself and you will be immersed into the geometry editing view.
Make the desired edits to your geometry, according to its type of
point or
line/polygon.
When finished, click ‘End Editing’ on the panel at the top of the map window.
The updated geometry is now STAGED and ready to save.
Replacing an existing Component Spatial Feature
To replace the spatial feature of a component, select the asset and navigate to the appropriate component info panel.
Within the component info panel, is a section titled ‘Spatial’. To replace the current geometry by changing the
geometry type (point, line, polygon), click the ‘Replace With’ menu.
From the menu list, choose the desired geometry type for the new spatial feature - point, line, or polygon.
The info panel will hide itself and you will be immersed into the geometry editing view.
When finished, click ‘End Editing’ on the panel at the top of the map window.
The replaced geometry is now STAGED and ready to save.
For more information, see the helpful tutorial video below.
Confirming Shared Spatial Features
To confirm whether or not an active component spatial feature is shared with other components on the asset record, navigate
to the parent asset info panel.
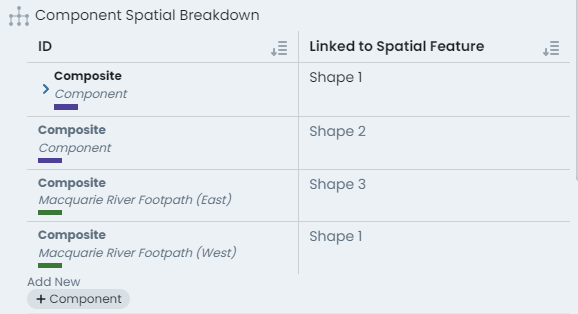
Within the parent asset info panel is a section titled ‘Component Spatial Breakdown’. This displays a table view specifying each
asset component alongside the geometry number* that the component is using.
In the above screenshot, the asset has four (4) components, and three (3) unique spatial features. The first and last component (in the table view)
are using ‘Shape 1’* and the middle two components reference their own shape. We therefore know that ‘Shape 1’ is shared across those two
components.
* this number is dynamically generated and simply serves to inform whether a shape feature is used on more than one component.
Modifying Point Features
Point features support relocation.
Moving Points
To move a point, simply:
Click once on its current location (it will change color to bright green).
Click-and-drag the feature from where it currently is, to where you wish it to be located.
Release to finish relocating.
When finished, click ‘End Editing’.
Modifying Lines & Polygons
Line/Polygon features support both relocation and reshaping.
Moving Lines/Polygons
To move a line or polygon, simply:
Click once on any of the line/perimeter segments.
Click-and-drag (from that segment). The entire shape will begin to follow your cursor across the map.
Release to finish relocating.
Reshaping Lines/Polygons
To reshape a line or polygon, simply:
Click once on any of the line/perimeter vertex nodes (it will change color to bright green).
Click-and-drag (from that vertex node) from where it currently is, to where you wish it to be located.
Release to finish relocating the node.
Repeat the above for other vertex nodes that need moving.
To ADD a new vertex node, click once on one of the segment center marker (white dot).
A new vertex node will be created, click-and-drag it to the desired location.
Release to finish relocating.
Creating Point Features
To create a new point feature:
Simply click on the map window where you want the point to be located.
To alter this location after initial placement, follow the instructions to relocate a
point
Creating Line & Polygons
To create a new line or polygon feature:
Click on the map window where you want the first vertex node to be located.
Then, continue to click map locations for each subsequent vertex node location.
Double-click to finish drawing new vertex nodes.
To alter the location of a vertex node after initial placement, follow the instructions to relocate a
line/polygon
Assign/Unassign Report Categories (Tags)
This document provides an overview on how to assign and unassign specific report category tags from asset
components in the Metrix Asset Management system. Please note that in order to use a report category,
it must be first defined
in the system configuration.
Assign Report Categories
To assign a report category (tag) against a component:
Navigate to the component info panel for the asset component.
Within the first ‘Identification’ section of the panel is a sub-section called ‘Report Categories’.
To add a new report category tag, click on the ‘+’ drop down list. The remaining available (not currently
assigned to the active component) report categories will render inside this menu.
Info
If the ‘+’ button is disabled, it means there are no available report categories, or, all report categories have
already been assigned to the active component.
For each report category, the menu will render a sub-menu so that you can choose the tag to apply. Choose
the desired combination you wish to apply.
The category assignment is now STAGED and ready to
save.
Unassign Report Categories
To unassign a report category (tag) from a component:
Navigate to the component info panel for the asset component.
Within the first ‘Identification’ section of the panel is a sub-section called ‘Report Categories’.
Current assignments will display in this section. On the right-hand side of each rendered category tag,
there is a ‘-’ (remove) icon. To unassign the category tag, simply click this icon.
The category un-assignment is now STAGED and ready to
save.
Update Condition
This document provides an overview on how to set or update the condition score of an asset
component in the Metrix Asset Management system. Please note that in order to use CUSTOM condition assessments,
one must be first defined
and assigned to the
relevant component group in the system configuration. Otherwise, the default condition assessment form will be used.
To set/update the condition for a component:
Navigate to the desired asset component and select the intervention info panel.
At the top of the intervention info panel, the current condition is summarised. If this part of the info panel
is not currently expanded, click on ‘Show More’ to expand it.
Click on ‘Update Condition’
A fly-out panel will then appear with the condition form rendered in edit mode. Fill out this form.
When finished, click ‘Update Condition’ at the bottom of the form.
The new condition entry is now STAGED and ready to
save.
Update Treatment
This document provides an overview on how to set, update, or remove an intervention treatment of an asset
component in the Metrix Asset Management system. Please note that in order to use an intervention
treatment definition, it must be first
defined
and assigned
to the relevant component group in the system configuration.
To set/update the intervention treatment for a component:
Navigate to the desired asset component and select the intervention info panel.
Within the intervention info panel, the current treatment details are summarised.
If this part of the info panel is not currently expanded, click on ‘Show More’ to expand it.
Click on ‘Update Treatment’
A fly-out panel will then appear with a list of
assigned
intervention treatments as well as other intervention related settings.
For your first step, choose the appropriate treatment from the list of treatments by clicking on it. Alternatively,
to completely clear the component’s treatment definition, select ‘Unassign Treatment from Component’ at the bottom of
the table.
At the bottom of the panel, a brief summary of the change is rendered. Additionally, there is a checkbox
asking if you wish to change any associated details along with the treatment. To update the:
Last Intervention Date,
Useful Life, and
Residual Life,
toggle the checkbox. Doing so will set the intervention date to today, the useful life to the treatment
definition’s default useful life, and the residual life to be equal with useful life.
For the above associated lifecycle metrics, users are able to overwrite the default values generated by
the system. Simply input any adjustments to the Last Intervention Date, Useful Life, and/or Residual Life
as deemed fit.
Info
Be aware that the useful life cannot be exceeded by the residual life. Also, when setting a value for the
residual life, please be aware that the default effective date for the residual life offset is today.
See Residual Life Calculations
When finished, click ‘Apply Condition’ at the bottom of the form.
The new treatment and any associated changes are now STAGED and ready to
save.
Info
The option to update the intervention date and useful/residual life values is provided as a way of
prompting users to consider possible side effects of a treatment change. Please also consider if the
condition should be updated, or any financial ledger entries made.
Update Next Treatment
This document provides an overview on how to set or update the next treatment specifications of an asset
component in the Metrix Asset Management system. Please note that in order to use particular treatment
definitions, they must first be
defined
and assigned
to the relevant component group in the system configuration.
To set/update the next treatment specification for a component:
Navigate to the desired asset component and select the intervention info panel.
Within the intervention info panel, the current definition for the next treatment is summarised.
If this part of the info panel is not currently expanded, click on ‘Show More’ to expand it.
Click on ‘Update Next Treatment’
A fly-out panel will then appear with the options for setting the next treatment specification.
The first part of the panel requires users to choose the manner in which the component next treatment
is being specified. This is either:
Estimated Cost: If choosing this method, enter the estimated cost of the next treatment into the
input box below the radio button.
Treatment with Override Unit of Measure: if choosing this method, pick a treatment from the drop-down
list, and also set an override value for the component cost units.
Treatment with Percentage of Component: if choosing this method, pick a treatment from the drop-down
list, and also set an override percentage share for the component cost units.
Set one of these options.
Next, set the estimated date for the next intervention treatment. This is an optional field.
Lastly, enter a description and reason for the next intervention treatment.
When finished, click ‘Apply Next Treatment’ at the bottom of the form.
The new treatment specification is now STAGED and ready to
save.
Bulk Updates
This document provides an overview on how to perform bulk updates across many asset components in the Metrix
Asset Management system. To use this feature, the components must be a part of an active
collection
set.
Info
Currently, bulk updates are restricted to the following areas:
Navigate to the main ‘Assets’ map in the Metrix Asset Management system.
Build a collection
containing the asset components you want to update.
When the collection is ready, click ‘Bulk Data Updates’ in the collection actions area. This will launch the
‘Bulk Data Update’ panel where assets and components within your collection are batched into their respective
classification configuration.
Data Updates
To perform data updates, ensure you are using the ‘Data’ tab of the bulk panel and then locate the specific
asset classification or component group on the left-hand side navigation tree.
On the right-hand side of the panel, a form will render showing you the possible data updates that you can
make.
Info
At the top of this form, the number of assets or components (from your collection set) that are associated with
the selected asset classification or component group will be rendered.
Remember, any changes you make on this panel will be played out across all of those records.
Report Category Updates
To perform report category updates, switch to the ‘Assign/Unassign Report Categories’ tab of the bulk panel.
Each report category defined in the system will be listed.
Click to expand the desired report category.
Each category has two options to choose from:
Bulk assign your collection set to a single report category option.
Bulk unassign your collection from one or more report category options.
Choose options from the left or right-hand side controls based on your desired outcome.
Bulk updating information is more prone to errors as the program cannot perform much of the validation
until the save step
of the process.
Component Finance Settings
This document provides an overview on how to set or update the financial settings for an asset
component in the Metrix Asset Management system. These settings relate to how the component is
going to be depreciated over it’s lifetime, including any residual value, and the rate at which
it is consumed.
Info
These settings are completely optional and serve to allow users to override the default status of
zero residual value and a remaining life vs carrying value based depreciation schedule.
Currently, maintaining these values will not impact ‘Estimated Depreciation’ report values or
consumption dashboards. They are designed for users to reference for information purposes.
To set/update the finance settings for a component:
Navigate to the desired asset component and select the transactions info panel.
Within the transactions info panel is a section title ‘Financial Settings’. It is here
that users can record such information.
Depreciable Value
To set or update the ‘Depreciable Value’, click on the current field value (it may be
set to ‘Not Set’).
First, choose whether the ‘Depreciable Value’ is to be a fixed dollar value, or a percentage figure
based on the component’s gross value. To completely remove the ‘Depreciable Value’ setting for the
active component, choose ‘Not Set’ and skip the next step.
Set the numeric value that corresponds with the option you set in the previous step. For percentage
figures, the value must be between 0 & 100.
Period Depreciation Value
To set or update the ‘Period Depreciation’ value, click on the current field value (it may be
set to ‘Not Set’).
First, choose whether the ‘Period Depreciation’ value is to be a fixed dollar value, or a percentage
figure based on the component’s gross value. To completely remove the ‘Period Depreciation’ value
setting for the active component, choose ‘Not Set’ and skip the next step.
Set the numeric value that corresponds with the option you set in the previous step. For percentage
figures, the value must be between 0 & 100.
The updated finance settings are now STAGED and ready to
save.
Posting Component Transactions
This document provides an overview on how to create a new posting to the financial transactions ledger
for an asset component in the Metrix Asset Management system. These transactions form the basis of
a component’s capital valuation and an organisation’s end of period financial statements.
Info
It should be noted that this is considered the ‘macro’ method of maintaining component capital value
in the system. Typically, movements of asset value are driven via complimentary methods such as:
CSV Data Import, and
Capital Budget Finalisation
To post a new financial transactions ledger entry for an asset component:
Navigate to the desired asset component and select the transactions info panel.
Within the transactions info panel is a section title ‘Transaction History’. It is here
that users can see past recorded movements, as well as post new ones.
To post a new financial transactions ledger entry, click ‘New Transaction’ at the top of the
history summary table.
Info
If the summary table and/or the ‘New Transaction’ button is not displayed for your active
component, it typically means that the asset component does not currently contain the
prerequisite information for carrying capital value.
This typically means that the underlying component is not Active.
Users may also be presented with warnings about missing construction/intervention dates
or useful life values - these are warnings that do not prevent transaction creation, but
should be considered.
A fly-out panel with a transaction generation form will appear.
Set the posting ‘Date’ for the new transaction. This is the date that the transactions value
will be recognised by the system. The date cannot extend beyond the end of the current
financial period (typically the end of the financial year).
Select the ‘Effect’ that the posting will have on the asset component. That is, will the
posting affect the component’s gross value, or its accumulated depreciation value.
From the transaction ‘Type’ drop-down list, choose the desired transaction type for the
new posting.
Info
Each transaction type in the list is tagged with the required polarity of the transaction ‘Value’
according to the chosen transaction type ‘Effect’. This will be either:
Positive: value must be greater than zero
Negative: value must be less than zero
Any: no restriction
Enter a transaction ‘Value’ with consideration for the polarity restriction for your chosen
transaction type.
Info
For the ‘Depreciation’ transaction type, an ‘Estimated Annual Depreciation Amount’ figure will be
displayed above the ‘Value’ input box for information purposes.
If the component does not currently carry any capital value, the ‘Finance Category’ will need
to be defined next. Choose a valid finance category from the drop-down list. If your
component already carries value, this drop-down will be disabled.
Lastly, enter a comment for the transaction.
When finished, click the button below the comment input box that contains a summary of
the transaction.
The transaction has been generated and is now STAGED and ready to
save.
Info
Users can also ‘Quick Populate’ the transaction entry page by choosing a recently generated
transaction from the ‘Recent’ drop-down list at the top of the panel. This will populate
each field according to the chosen recent transaction.
Deleting Component Transactions
This document provides an overview on how to delete existing postings to the financial transactions ledger
for an asset component in the Metrix Asset Management system.
Info
Deleting a transaction CANNOT BE UNDONE and should only be performed as a last resort. An alternative
option (to deleting a transaction) would be to post a transaction of the same transaction type, with an
obverse value to the transaction you are over-riding, where allowed by the transaction type.
To delete an existing financial transactions ledger entry for an asset component:
Navigate to the desired asset component and select the transactions info panel.
Within the transactions info panel is a section title ‘Transaction History’. It is here
that users can see past recorded movements, and delete them.
In the transaction history table, each entry contains a ‘Delete’ option (rendered as a trash-can) on
the far right-hand side of the row. To delete a transaction entry, click this button.
Info
When processing the deletion of one or more transactions, the system considers the following:
Following removal of the transactions, the component must not be left with a negative carrying value.
Transactions from previous financial periods cannot be removed.
These restrictions do not apply to transactions that have not yet been saved/committed to the system.
Repeat the above step for each transaction that you may need to remove.
The transaction(s) have been STAGED for removal and are ready to
save.
Editing Barcode Values
This document provides an overview on how to set or remove a barcode value of an asset or asset
component in the Metrix Asset Management system. Please note that in order to modify barcode
values, the user must have the appropriate permissions set.
To set the barcode value for an asset or component:
Navigate to the desired asset or component and select the basic info panel.
Within the info panel ‘Identification’ section, details pertaining to any current barcode value assignment
is shown. If no value has been assigned, this will be empty.
Hovering over the barcode value will render a preview of the barcode
To assign a barcode value (where one has not previously been assigned), click ‘Add Barcode Link’.
Note: If the asset or component has a previously assigned barcode value, this will need to be removed/unlinked
first.
A panel will slide out asking for the value of the barcode to link to the active asset or component.
Enter the value within this text entry.
The panel will validate the supplied barcode value. If the value is NOT valid, the ‘Save (Immediatley)’ button
will be disabled - follow the prompts to ‘repair’ the entered value.
To save the new barcode value, click ‘Save (Immediately)’. Note; this change (as inferred) does NOT go via
the staged changes process. Rather, the link will occur immediatley.
To remove the barcode value for an asset or component:
Navigate to the desired asset or component and select the basic info panel.
Within the info panel ‘Identification’ section, details pertaining to any current barcode value assignment
is shown.
To remove the currently assigned barcode link for an asset or component, simply click the ‘Trash’ icon
next to the barcode value.
A dialog will appear asking for confirmation. Confirm the deltion.
Creating Assets & Components
This section provides guidance on creating new assets or asset component records within the
Metrix Asset Management system, including:
Creating new Assets and Asset Components
Appending Asset Components to Existing Assets
Subsections of Creating Assets & Components
About
This section provides guidance on creating new assets or asset component records within the
Metrix Asset Management system, including:
Creating Assets
Appending Components to Assets
Subsections of About
The Bare Minimum
The Metrix Asset Management system supports a wide scope of asset related data. When it comes to
creating new records within your system, more information is always encouraged. As a minimum however,
the following record types are required:
Each asset must contain at least one (1) asset component record.
Additionally, the following resources or fields are MANDATORY:
A valid asset classification and component group definition,
A short Asset description and Component description,
A valid Component status
A valid Spatial Feature Definition
How To
This section provides guidance on creating new assets or asset component records within the
Metrix Asset Management system, including:
Creating a new asset record in the Metrix Asset Management system is a simple process that involves
choosing an asset classification, defining a spatial feature, and then populating the asset and
component data fields.
To create a new asset record:
Navigate to the main ‘Assets’ page.
Above the map window, is a button titled ‘Create Asset’. Click this button.
A fly-out ‘Create New Asset’ panel will show at the bottom of the map window. Firstly, it will render
a list of available asset classes configured in your system.
Info
The asset class is the ‘first level’ of the asset classification
structure.
Choose an asset class for your new asset.
The panel will then render the the list of asset classifications relative to your chosen asset class.
Choose an asset classification for your new asset.
On the right-hand side of the panel, you will then be presented with options for creating the asset
components. Firstly, confirm which component group(s) you wish to include as components for your new
asset.
Info
For each component group that remains checked, the system will generate one (1) component.
Next, choose the initial status from the status drop-down list. The default status is ‘Proposed’. Each
of the components, defined in step 5, will be assigned this status.
Then set the effective date for the new asset components via the calendar input control. Each of the
components created, defined in step 5, will be generated as at this date.
The last step involved in creating a new asset is to define the spatial feature that will be assigned
to ALL of the asset components, defined in step 5. Click on either
New Point,
New Line, or
New Polygon
and digitise the spatial feature as per these instructions for
points ↗ or
these instructions for
lines/polygons ↗.
Info
To finish digitising lines and polygons, simply double-click the map.
When you have finished digitising the spatial feature, click ‘Finish & Create’ at the bottom of the panel. Assets
will be created immediately upon clicking ‘Finish & Create’. They do NOT go via the staged changes process.
The asset, once created, will then be selected and ready for you to update the attributes, intervention details, and
condition as necessary.
Appending Components to Assets
Creating a new component record against an existing asset in the Metrix Asset Management system
is a simple process that involves selecting the parent asset, choosing the target component group,
confirming or defining a spatial feature, and then populating your new component data fields.
To create a new component record against an existing asset:
Navigate to the main ‘Assets’ page and make a
selection
from the map screen.
On the left-hand side of the info panel (right side of the page) the ‘Components’ switcher lists each
component group (from the asset classification configuration) available to the asset. At the bottom of
this listing, there is a button labelled ‘Add New’ and titled ‘Component’. Click this button.
A fly-out ‘Create New Component’ panel will show at the bottom of the map window rendering your
component creation options. Firstly, confirm which component group(s) you wish to generate and append
to the parent asset.
Info
For each component group that remains checked, the system will generate one (1) component.
Next, choose the initial status from the status drop-down list. The default status is ‘Proposed’. Each
of the components, defined in step 3, will be assigned this status.
Then set the effective date for the new components via the calendar input control. Each of the
components created, defined in step 3, will be generated as at this date.
The last step involved in appending components for an asset is to define the spatial feature that will be assigned
to the new components, defined in step 5. Click on either
New Point,
New Line,
New Polygon, or
Create with / Choose from Current Asset Geometry
New Spatial Feature
If defining a new spatial feature, digitise the geometry as per these instructions for
points ↗ or
these instructions for
lines/polygons ↗.
Info
To finish digitising lines and polygons, simply double-click the map.
When you have finished generating or confirmting the spatial feature, click ‘Finish & Create’ at the bottom of the panel.
To finish, click ‘Finish & Create’.
Using Existing Spatial Features
If you choose to inhertit the spatial feature from an existing component on the parent asset, one of two workflows
will occur:
If the components of the parent asset rely on a single spatial feature, the fourth button option will be labelled
‘Create with Current Asset Geometry’. Clicking this option will complete the process and your new components will
be appended to the parent asset and share the one spatial feature.
If the components of the parent asset rely on multiple spatial features, the fourth button option will be labelled
‘Choose from Current Asset Geometries’. Clicking this option will present another panel requiring you to choose
which spatial feature to inherit.
As you hover on each option row (representing a distinct spatial feature), the corresponding feature will be highlighted
in the map window.
Click a spatial feature row to choose your geometry. Then click ‘Create Component’.
Components will be created immediately - they do NOT go via the staged changes process.
The components, once created, will then be selected and ready for you to update the attributes, intervention details, and
condition as necessary.
Special Record Actions
This section provides guidance on how to perform specific Asset Management actions in the Metrix
Asset Management system, for existing records. Including:
Splitting Assets and/or Components
Reclassifying Assets and/or Components
Setting Component Status
Deleting Assets and/or Components
Performing a Financial Re-Categorisation
Subsections of Special Record Actions
About
This section provides guidance on how to perform specific Asset Management actions in the Metrix
Asset Management system, for existing records. Please note that asset and component actions do NOT
go via the staged
changes process. Sections include:
The ability to split an Asset is vitally important in keeping the Organisation’s financial reporting, engineering concepts, and asset management data policies in sync. The core concept involves splitting a linear geometry (representing one or more Components associated with an Asset) at any given coordinate, at an effective date.
The returned feature set represents the two (or more in certain cases) new Assets, each containing a distinct copy of the original Components, with each new Component being proportionately associated with one of the two (or more) resultant geometries. The original Asset and Components are deprecated (see section on deprecation).
The following concepts are covered in this article:
Note: This article is specifically addressing Asset Split operations where the goal is to generate two (or more) distinct new Assets with their own Components (mirroring the original). Users may also be interested in reading about
splitting asset components
whereby the parent Asset is maintained, but a sub-selection of Components are split and duplicated within said parent Asset.
How a Split Works
The basic mechanics of the Asset Split operation is that a user submits a request to the system for a split to occur. The system will respond (assuming no errors occur) with the required Asset, Component, and Resource inserts and updates that need to occur. Accepting this response will process the Split operation. This process is summarised below:
User submits request for a split operation
System assesses the request and responds with a detailed summary of the inserts and updates required to achieve the split
User accepts the response, and the split occurs.
Requesting a Split
To request a split, the following information is required:
The Split Level (split_level) which must be set to ‘asset’ for an Asset Split.
The Asset Record ID (asset_uid) of the Asset being split
The Splitting Blade definition (intersection_wkt) defined in Well Known Text.
An optional Posting Date (posting_date) for when transactions associated with the split operation should occur. This field will default to the current date/time if empty.
An optional Effective Date (effective_date) for when the split should occur. This field will default to the current date/time if empty.
Optional Split Flags (flags) that can control facets of what will be copied across to the new Assets and Components. See ‘Advanced Splitting: Resource Exclusions’ for more information.
System Assesses the Request and Response
Upon receiving a split request, the system will review the prohibitions detailed in the section, ‘When a Split can Occur’. It will then commence building a response that (if accepted by the user) instructs the system on how to:
Deprecate the Old (split) Asset and Components
Create the new Asset and Components
Append the appropriate valuations and resources to the new Assets and Components.
User Accepts the Response and the Split Occurs
After reviewing the response - where the user can investigate in detail what will and wont be created - the user can accept the response and the relative Split Operation will occur.
How the Split Works at a Geometry Level
In order to perform the split, the user must provide a splitting blade - a linear geometry that cuts across the Component geometry/geometries at the desired split coordinate. See screenshot below:
In the above screenshot, the Asset (Twynam Avenue) is highlighted in yellow and the user provided splitting blade is located about 25% along it’s overall length. For the purpose of this example, we will assume that Twynam Avenue has three (3) Components - earthworks, base, and seal - all sharing the same linear geometry running from Governors Parade to Barr Street.
Prior to the split, the Twynam Avenue Asset Components could be represented by the following (basic) attribute data set:
Description
Component Class
Cost Units
Units of Measure
Treatment
Twynam Avenue Earthworks
Earthworks
357
metres
nil
Twynam Avenue Base
Base
357
metres
300mm Compacted Gravel Base
Twynam Avenue Seal
Surface
2142
square metres
10mm Initial Seal
With the ID of the Asset and the definition of the splitting blade supplied, the system first derives the NEW Component Geometries that would result from the split operation. See screenshot below:
In the above screenshot, the split has occurred and the first of the resultant two geometries is highlighted in yellow. The remaining portion of Twynam Avenue is associated with the second of the resultant two geometries.
Following the split, Twynam Avenue is now two (2) distinct Assets whose Components could be represented by the following attribute data set:
Asset 1 (highlighted in yellow)
Description
Component Class
Cost Units
Units of Measure
Treatment
Twynam Avenue Earthworks
Earthworks
89.25
metres
nil
Twynam Avenue Base
Base
89.25
metres
300mm Compacted Gravel Base
Twynam Avenue Seal
Surface
535.5
square metres
10mm Initial Seal
NOTE: the proportion of length between ‘Asset 1’ and the original Asset is assumed to be 25% - the System has returned the new Cost Unit values based on this geometric truth.
Asset 2 (not highlighted)
Description
Component Class
Cost Units
Units of Measure
Treatment
Twynam Avenue Earthworks
Earthworks
267.75
metres
nil
Twynam Avenue Base
Base
267.75
metres
300mm Compacted Gravel Base
Twynam Avenue Seal
Surface
1606.5
square metres
10mm Initial Seal
NOTE: the returned data for ‘Asset 2’ represents 75% of the original Cost Unit values. All Components have been duplicated to the second Asset and can be managed in isolation of Asset 1 from now on.
When a Split can Occur
The following restrictions are enforced by the system when a user attempts to perform an Asset Split operation:
The splitting blade MUST pass through the subject Geometry/Geometries at some point.
The construction/Intervention dates of the Components cannot be after the effective date.
The status effect of the Components must be active.
The Component must have no Transaction postings that occur after the posting date.
The posting date must not conflict with a Locked Financial Year.
Only linear Geometries can be split.
Resources Assigned to the New Assets
Following an Asset Split, the following resources are copied across to the new Assets. They are discussed in detail below.
Original Attribution
Transaction Summary
Condition History
Report Categories
Task Records
Original Attribution
Each new Asset or Component record that is created will inherit it’s attribution from the original Asset or relevant Component. Attributes are copied to the new Assets and Components unchanged - The ONLY EXCEPTION to this is the cost units value, which is modified by the Component’s relative proportionality.
Transaction Summary
Each new Component record that is created will inherit a proportionate baseline value from the original relevant Component and the original Component’s Value is written-off. This means there is ZERO change in overall value in the system. Consider the following 50/50 split of a single Component into two (2) new Components.
The original transaction schedule would look something like this, with the carrying value displayed at the bottom.
Comp ID
Year
Transaction Type
Value
comp_1
2015
Recognition (Gross)
$1500
comp_1
2016
Annual Depreciation
-$150
comp_1
2017
Annual Depreciation
-$150
comp_1
2018
Annual Depreciation
-$150
comp_1
2019
Annual Depreciation
-$150
$900
As a part of the Asset Split operation, the following transaction schedule would be generated and applied. Note: transaction schedule simplified to years for the example.
Comp ID
Year
Transaction Type
Value
Comment
comp_1
2020
Adjustment (Depreciation)
$600
Writing off the accumulated depreciation
comp_1
2020
Adjustment (Gross)
-$1500
Writing off the gross value
comp_2
2020
Recognition (Gross)
$750
Bringing on 50% of gross value to the first new Component.
comp_2
2020
Recognition (Gross)
-$300
Bringing on 50% of accumulated depreciation to the first new Component.
comp_3
2020
Recognition (Gross)
$750
Bringing on 50% of gross value to the second new Component.
comp_3
2020
Recognition (Gross)
-$300
Bringing on 50% of accumulated depreciation to the second new Component.
By the end of the process, the valuation summary for ALL Components would be:
Comp ID
Gross Value
Depreciation Value
Carrying Value
comp_1
$0
$0
$0
comp_2
$750
-$300
$450
comp_3
$750
-$300
$450
$1500
-$600
$900
Condition History
For each newly created Component, the relevant Condition History is copied to across in a split operation. The term ‘relevant’ refers to whether or not the Condition record concerned the spatial bounds associated with the new Component (see section: Advanced Splitting: Multiple Geometry Features), as well as whether or not the Condition record existed at the ‘Effective Date’ for the split operation.
The following table details this concept of ‘relevant’ Condition history for an Effective Date of 12/10/2000. Note, each row represents a Condition record that lasts from the Assessment Date until the Assessment Date of the subsequent row. That is, the above Component was considered to be in Condition 1 from January 1993 to February 1997.
Assessment Date
Condition
Carried Over?
22/01/1993
1
No
27/02/1997
2
No
15/04/1999
3
Yes (see note below)
28/01/2002
4
Yes
26/01/2008
5
Yes
Note: this condition record is carried over, however the Assessment Date is set to the Effective Date (October 2000) and a comment is added to reflect the original Assessment Date.
Report Categories
For each newly created Component, the LATEST (as at the Effective Date) relevant Report Categories are copied across in a split operation. That is, if a Component held a Special Schedule 7 Category of ‘Roads’ at the Effective Date, each new Component would inherit this Report Category.
Task Records
For each newly created Component, the relevant Task Records are copied across in a split operation. This occurs at both the Asset and Component Register level. Please note, the same rules of ‘relevancy’ that apply to the Condition History, apply to Task Records.
What happens to the Original Asset and Components
Following an Asset Split operation, the original Asset and ALL of it’s Components are marked with a status code of ‘Deprecated’. This is a special system status code (that users cannot access) which marks the record as ‘superseded by another record or records’. Deprecated records remain in the system, but they are excluded from the default map view, tables, filters, dashboards, and reports.
Information associated with a Deprecated Asset record can be fetched via the NEW Asset record(s). Each new record maintains a ‘Deprecated Parent’ linkage back to the original Asset.
Note: In the case of an Asset Split operation, only the Asset records receive a Deprecated Parent link back to the original Asset. The Component’s do not receive such a linkage in this case as the operation was at the Asset level.
Advanced Splitting: Multiple Geometry Features
In certain situations, an Asset’s Components may not all be represented by the same Geometry record. See the cross-section view below:
In the above example, the Asset (Twynam Avenue) is associated with five (5) Components. An earthworks Components, represented by a single Geometry running from Governors Place to Barr Street. Two (2) base Components running from Governors Place to Matthews Street and then from Matthews Street to Barr Street. And Two (2) seal Components running from Governors Place to Matthews Street and then from Matthews Street to Barr Street (identical to the base).
Given the above scenario, if Poate Street was to be extended such that it now crosses Twynam Avenue, the Asset Management and Engineering principles may require Twynam Avenue to be now represented as two (2) Assets, split by it’s intersection with Poate Street. In this case, the splitting blade would look like the following:
In the above, the Twynam Avenue Asset is to be split by its new full intersection with Poate Street. For the purpose of the example, we will assume the split blade is 75% along the original Asset’s length.
The resultant Assets and Components of such a split are shown below. The original Seal 1 and Base 1 features are not altered by proportionality, they are simply copied and associated with the new, shorter, Twynam Avenue Asset. The Seal 2, Base 2, and Earthworks Components however, are split between the two new Twynam Avenue Assets.
In the above, the Twynam Avenue Asset is to be split by its new full intersection with Poate Street. For the purpose of the example, we will assume the split blade is 75% along the original Asset’s length.
The association and proportion share of the new Assets and Components can be represented in the following table. As can be seen, Base 1 and Seal 1 features are copied and wholly associated with the first Asset (Governors Pde to Matthews Street). However, the Earthworks, Base 2, and Seal 2 are copied and distributed across the splitting blade.
Original Asset
New Asset
Original Component
New Component Share (%)
Twynam Ave
Twynam Ave (Governors Pde to Matthews St)
Earthworks
75%
Twynam Ave
Twynam Ave (Governors Pde to Matthews St)
Base 1
100%
Twynam Ave
Twynam Ave (Governors Pde to Matthews St)
Base 2
60%
Twynam Ave
Twynam Ave (Governors Pde to Matthews St)
Seal 1
100%
Twynam Ave
Twynam Ave (Governors Pde to Matthews St)
Seal 2
60%
Twynam Ave
Twynam Ave (Governors Pde to Matthews St)
Earthworks
75%
Twynam Ave
Twynam Ave (Matthews St to Barr St)
Earthworks
25%
Twynam Ave
Twynam Ave (Matthews St to Barr St)
Base 2
40%
Twynam Ave
Twynam Ave (Matthews St to Barr St)
Seal 2
40%
Splitting Asset Components
The ability to split a Component is vitally important in keeping the Organisation’s financial reporting, engineering
concepts, and asset management data policies in sync. The core concept involves splitting a linear geometry (
representing one or more Components) at any given coordinate, at an effective date.
The returned feature set represents the two or more new Components, each containing a distinct copy of the original
Components, with each new Component being proportionately associated with one of the two (or more) resultant geometries.
The original Components are deprecated (see section on deprecation) and the new Components are inherited by the original
Asset.
The following concepts are covered in this article:
Note: This article is specifically addressing Component Split operations where the goal is to maintain the single
Asset parent. Users may also be interested in reading about
asset splitting
whereby the parent Asset is
also deprecated and the result is two (or more in certain cases) new Assets with all new associated Components.
How a Split Works
The basic mechanics of the Component Split operation is that a user submits a request to the system for a split to
occur. The system will respond (assuming no errors occur) with the required Component/Resource inserts and updates that
need to occur. Accepting this response will process the Split operation. This process is summarised below:
User submits request for a split operation
System assesses the request and responds with a detailed summary of the inserts and updates required to achieve the
split
User accepts the response, and the split occurs.
Requesting a Split
To request a split, the following information is required:
The Split Level (split_level) which must be set to ‘component’ for a Component Split.
The Asset Record ID (asset_uid) of the Asset that ‘owns’ the Component(s) being split.
The Component Record IDs (component_uids) of the Component(s) that are being split.
The Splitting Blade definition (intersection_wkt) defined in Well Known Text.
An optional Effective Date (effective_date) for when the split should occur. This field will default to the current
date/time if empty.
Optional Split Flags (flags) that can control facets of what will be copied across to the new Components. See '
Advanced Splitting: Resource Exclusions’ for more information.
System Assesses the Request and Response
Upon receiving a split request, the system will review the prohibitions detailed in the section, ‘When a Split can
Occur’. It will then commence building a response that (if accepted by the user) instructs the system on how to:
Deprecate the Old (split) Components
Create the new Components against the original Asset
Append the appropriate valuations and resources to the new Components.
User Accepts the Response and the Split Occurs
After reviewing the response - where the user can investigate in detail what will and wont be created - the user can
accept the response and the relative Split Operation will occur.
How the Split Works at a Geometry Level
In order to perform the split, the user must provide a splitting blade - a linear geometry that cuts across the
Component geometry/geometries at the desired split coordinate. See screenshot below:
*In the above screenshot, the Asset (Twynam Avenue) is highlighted in yellow and the user provided splitting blade is
located about 25% along it’s overall length. For the purpose of this example, we will assume that Twynam Avenue has
three (3) Components - earthworks, base, and seal - all sharing the same linear geometry running from Governors Parade
to Barr Street.*
Prior to the split, the Twynam Avenue Components could be represented by the following (basic) attribute data set:
Description
Component Class
Cost Units
Units of Measure
Treatment
Twynam Avenue Earthworks
Earthworks
357
metres
nil
Twynam Avenue Base
Base
357
metres
300mm Compacted Gravel Base
Twynam Avenue Seal
Surface
2142
square metres
10mm Initial Seal
Assuming the user only wants to split the Base and Surface Components (leaving the Earthworks untouched), they would
supply the Asset Record ID, and the two (2) Component ID’s relating to the Surface and Base. The system then derives the
NEW Component Geometries that would result from the split operation. See screenshot below:
*In the above screenshot, the split has occurred and the first of the resultant two geometries is highlighted in
yellow - a portion of the base and seal will be associated with this geometry. The remaining portion of base and seal
Components are associated with the second of the resultant two geometries. The earthworks are still associated with the
original geometry record.*
Following the split, Twynam Avenue is still one distinct Asset, however, instead of having three (3) Components, it now
has five (5). The new Component Structure (ignoring deprecated Components) would look like this:
Description
Component Class
Cost Units
Units of Measure
Treatment
Twynam Avenue Earthworks
Earthworks
357
metres
nil
Twynam Avenue Base 1
Base
89.25
metres
300mm Compacted Gravel Base
Twynam Avenue Seal 1
Surface
535.5
square metres
10mm Initial Seal
Twynam Avenue Base 2
Base
267.75
metres
300mm Compacted Gravel Base
Twynam Avenue Seal 2
Surface
1606.5
square metres
10mm Initial Seal
NOTE: the proportion of length between the smaller geometry and the original Asset is assumed to be 25% - the System
has returned the new Cost Unit values based on this geometric truth.
When a Split can Occur
The following restrictions are enforced by the system when a user attempts to perform an Asset Split operation:
The splitting blade MUST pass through the subject Geometry/Geometries at some point.
The construction/Intervention dates of the Components cannot be after the effective date.
The status effect of the Components must be active.
The Component must have no Transaction postings that occur after the effective date.
The effective date must not conflict with a Locked Financial Year.
Only linear Geometries can be split.
Resources Assigned to the New Components
Following a Component Split, the following resources are copied across to the new Components. They are discussed in
detail below.
Original Attribution
Transaction Summary
Condition History
Report Categories
Task Records
Original Attribution
Each new Component record that is created will inherit it’s attribution from the original relevant Component. Attributes
are copied to the new Components unchanged - The ONLY EXCEPTION to this is the cost units value,
which is modified by the Component’s relative proportionality.
Transaction Summary
Each new Component record that is created will inherit a proportionate baseline value from the original relevant
Component and the original Component’s Value is written-off. This means there is ZERO change in overall value in the
system. Consider the following 50/50 split of a single Component into two (2) new Components.
The original transaction schedule would look something like this, with the carrying value
displayed at the bottom.
Comp ID
Year
Transaction Type
Value
comp_1
2015
Recognition (Gross)
$1500
comp_1
2016
Annual Depreciation
-$150
comp_1
2017
Annual Depreciation
-$150
comp_1
2018
Annual Depreciation
-$150
comp_1
2019
Annual Depreciation
-$150
$900
As a part of the Component Split operation, the following transaction schedule would be generated and applied. Note:
transaction schedule simplified to years for the example.
Comp ID
Year
Transaction Type
Value
Comment
comp_1
2020
Adjustment (Depreciation)
$600
Writing off the accumulated depreciation
comp_1
2020
Adjustment (Gross)
-$1500
Writing off the gross value
comp_2
2020
Recognition (Gross)
$750
Bringing on 50% of gross value to the first new Component.
comp_2
2020
Recognition (Gross)
-$300
Bringing on 50% of accumulated depreciation to the first new Component.
comp_3
2020
Recognition (Gross)
$750
Bringing on 50% of gross value to the second new Component.
comp_3
2020
Recognition (Gross)
-$300
Bringing on 50% of accumulated depreciation to the second new Component.
By the end of the process, the valuation summary for ALL Components would be:
Comp ID
Gross Value
Depreciation Value
Carrying Value
comp_1
$0
$0
$0
comp_2
$750
-$300
$450
comp_3
$750
-$300
$450
$1500
-$600
$900
Condition History
For each newly created Component, the relevant Condition History is copied to across in a split operation. The term '
relevant’ refers to whether or not the Condition record concerned the spatial bounds associated with the new Component (
see section: Advanced Splitting: Multiple Geometry Features), as well as whether or not the Condition record existed at
the ‘Effective Date’ for the split operation.
The following table details this concept of ‘relevant’ Condition history for an Effective Date of 12/10/2000. Note,
each row represents a Condition record that lasts from the Assessment Date until the Assessment Date of the subsequent
row. That is, the above Component was considered to be in Condition 1 from January 1993 to February 1997.
Assessment Date
Condition
Carried Over?
22/01/1993
1
No
27/02/1997
2
No
15/04/1999
3
Yes (see note below)
28/01/2002
4
Yes
26/01/2008
5
Yes
Note: this condition record is carried over, however the Assessment Date is set to the Effective Date (October 2000)
and a comment is added to reflect the original Assessment Date.
Report Categories
For each newly created Component, the LATEST (as at the Effective Date) relevant Report Categories are copied across in
a split operation. That is, if a Component held a Special Schedule 7 Category of ‘Roads’ at the Effective Date, each new
Component would inherit this Report Category.
Task Records
For each newly created Component, the relevant Auxiliary Data Records are copied across in a split operation. Please
note, the same rules of ‘relevancy’ that apply to the Condition History, apply to Task Records.
What happens to the Original Components
Following a Component Split operation, the original Components are marked with a status code of ‘Deprecated’. This is a
special system status code (that users cannot access) which marks the record as ‘superseded by another record or
records’. Deprecated records remain in the system, but they are excluded from the default map view, tables, filters,
dashboards, and reports.
Information associated with a Deprecated Component record can be fetched via the NEW Component record(s). Each new
record maintains a ‘Deprecated Parent’ linkage back to the original Component.
Advanced Splitting: Resource Exclusions
When requesting a Component Split operation, a user can supply some optional flags that will alter what resources the
newly created Components will receive. The flags currently available in the system are:
Apportion Cost Units (apportion_cost_units - true/false): If not supplied, this defaults to TRUE. This flag
indicates that the user wishes for the Cost Unit values of each new Component to be proportionately set based on its '
share’ of the original Component. If set to FALSE, each new Component will receive a Cost Units value equal to that of
it’s parent Component.
Copy Condition History (copy_condition_history - string): If not supplied, this defaults to all. This flag
indicates what sort of Condition History the user would like to translate to the new Components. The following options
are available:
all (default): All relevant Condition history will be copied.
latest: Only the most recent Condition record (relative to Effective Date) will be copied.
none: No Condition records will be copied.
Copy Report Categories (copy_report_categories - true/false): If not supplied, this defaults to TRUE. This flag
indicates that the user wishes for the relevant Report Categories to be copied to the new Components.
Copy Task Records (copy_auxiliary_data - string): If not supplied, this defaults to all. This flag
indicates what sort of Task Record History the user would like to translate to the new Components.
The following options are available:
all (default): All relevant Records will be copied.
latest: Only the most recent Record (relative to Effective Date) will be copied.
none: No Records will be copied.
Advanced Splitting: Multiple Geometry Features
In certain situations, an Asset’s Components may not all be represented by the same Geometry record. See the
cross-section view below:
*In the above example, the Asset (Twynam Avenue) is associated with five (5) Components. An earthworks Components,
represented by a single Geometry running from Governors Place to Barr Street. Two (2) base Components running from
Governors Place to Matthews Street and then from Matthews Street to Barr Street. And Two (2) seal Components running
from Governors Place to Matthews Street and then from Matthews Street to Barr Street (identical to the base).*
Given the above scenario, if Poate Street was to be extended such that it now crosses Twynam Avenue, the Asset
Management and Engineering principles may require the Component’s of Twynam Street to reflect this new extent. In this
case, the splitting blade would look like the following:
*In the above, the Twynam Avenue Components are to be split by its new full intersection with Poate Street. For the
purpose of the example, we will assume the split blade is 75% along the original Asset’s length.*
The resultant Components of such a split are shown below. The original Seal 1 and Base 1 features are not altered by
proportionality, they are therefore UNMODIFIED by the split operation. The Seal 2, Base 2, and Earthworks Components
however, are split by the intersection blade.
*In the above, the Twynam Avenue Components are to be split by its new full intersection with Poate Street. For the
purpose of the example, we will assume the split blade is 75% along the original Asset’s length.*
The association and proportion share of the new Components can be represented in the following table. As can be seen,
Base 1 and Seal 1 features are left UNMODIFIED. However, the Earthworks, Base 2, and Seal 2 are copied and
distributed across the splitting blade.
Asset
Original Component
New Component Share (%)
Comment
Twynam Ave
Base 1
100%
Unmodified
Twynam Ave
Seal 1
100%
Unmodified
Twynam Ave
Earthworks
75%
Long section of Split
Twynam Ave
Earthworks
25%
Short section of Split
Twynam Ave
Base 2
60%
Long section of Split
Twynam Ave
Base 2
40%
Short section of Split
Twynam Ave
Seal 2
60%
Long section of Split
Twynam Ave
Seal 2
40%
Short section of Split
Merging Assets
The ability to merge an Asset is vitally important in keeping the Organisation’s financial reporting, engineering concepts, and asset management data policies in sync. The core concept involves merging/combining two or more spatial features (representing one or more Assets), at an effective date.
The returned feature represents a new combined Asset, containing a distinct copy of the original Asset and Component’s data, with each being associated with parent Assets/Components. The original Assets and Components are deprecated (see section on deprecation).
The following concepts are covered in this article:
Note: This article is specifically addressing Asset Merge operations where the goal is to generate one new Asset with its own Component(s) from two or more Assets. At the date of publication of this guide, the ability to merge Components within an Asset is not supported by this tool.
How a Merge Works
The basic mechanics of the Asset Merge operation is that a user submits a request to the system for a merge to occur. The system will respond (assuming no errors occur) with the required Asset, Component, and Resource inserts and updates that need to occur. Accepting this response will process the Merge operation. This process is summarised below:
User submits request for a merge operation
System assesses the request and responds with a detailed summary of the inserts and updates required to achieve the merge
User resolves any merge conflicts identified by the system (such as conflicting attribute values)
User accepts the response, and the merge occurs.
For Components within each Asset, they will be merged in accordance with their Component Group classification. For example, when merging two road Assets, all child Surface Components will be merged together, all child base Components will be merged together, and all child earthwork Components will be merged together.
Requesting a Merge
To request a merge, the following information is required:
The Asset Record IDs (asset_uid) of the Assets being merged
A Posting Date (posting_date) for when any transactions associated with the merge operation should occur. This field will default to the current date/time if empty.
System Assesses the Request and Response
Upon receiving a merge request, the system will review the prohibitions detailed in the section, ‘When a Merge can Occur’. It will then commence building a response that (if accepted by the user) instructs the system on how to:
Deprecate the Old (merged) Assets and Components
Create the new Asset and Components
Append the appropriate valuations and resources to the new Asset and Components.
During this process, the system analyses the Asset and Component attribution from all records being merged. Any conflicting values will be flagged to the user for resolution.
User Resolves any Merge Conflicts Identified by the System
The system will return a summary of merge request. This summary will include details regarding any conflicts that need to be resolved before continuing. Along with each conflict, the system will return some suggested values that might resolve the conflict. Where appropriate (for numeric values) the suggested values may include sums, averages, min and/or max values of the input Components for the Component Group in question.
Examples of conflicts, system suggestions, and possible ways to resolve them, include:
Mismatch Cost Units: This is expected as each Component being merged will likely have a different value for Cost Units, reflecting their individual size/quantity. The system will return the sum of all Cost Units for that Component Group, as well as the average, the min, and the max value across the Component Group. Users may wish to elect the SUM value, reflecting the fact that the new Components size will be an aggregate of each input Components size.
Mismatch Custom Text Attribute: This can occur from time to time and will typically not be accompanied by any ‘smart’ sugestions (sum, average, etc.). Users will be asked to choose one of the values from the input Components for the Component Group.
In all of the above examples, and during any merge operation, users do NOT have to settle for any of the suggested values (smart or otherwise). In all cases, a manual override is available for conflicting attributes.
User Accepts the Response and the Merge Occurs
After reviewing the response and resolving all merge conflicts - where the user can investigate in detail what will and wont be created - the user can accept the response and the relative Merge Operation will occur.
How the Merge Works at a Component by Component Level
In order to perform the merge, the user must provide two or more valid Asset Records.
Prior to the merge, the Twynam Avenue Asset Components could be represented by the following (basic) attribute data set:
Asset 1
Description
Component Class
Cost Units
Units of Measure
Treatment
Twynam Avenue Earthworks
Earthworks
89.25
metres
nil
Twynam Avenue Base
Base
89.25
metres
300mm Compacted Gravel Base
Twynam Avenue Seal
Surface
535.5
square metres
10mm Seal
Asset 2
Description
Component Class
Cost Units
Units of Measure
Treatment
Twynam Avenue Earthworks
Earthworks
267.75
metres
nil
Twynam Avenue Base
Base
267.75
metres
300mm Compacted Gravel Base
Twynam Avenue Seal
Surface
1606.5
square metres
14mm Seal
NOTE: each Surface Component have differing values for ‘Treatment’. This will be a merge conflict that user must resolve in order to complete the merge. Additionally, each of the Cost Unit value conflicts (per Component Group) will need to be resolved.
The system, upon reviewing the merge request, will return a merge preview response highlighting any merge conflicts. For the above example (and for the information supplied), the following merge conflicts are likely:
Component Class
Merge Conflict
Values Encountered
Possible Sollutions
Earthworks
Cost Units
89.25, 267.75
Sum(357), Avg(178.5), Min(89.25), Max(267.75), Other (User Defined)
Base
Cost Units
89.25, 267.75
Sum(357), Avg(178.5), Min(89.25), Max(267.75), Other (User Defined)
Surface
Cost Units
535.5, 1606.5
Sum(2142), Avg(1071), Min(535.5), Max(1606.5), Other (User Defined)
Surface
Treatment
10mm Seal, 14mm Seal
10mm Seal, 14mm Seal, Other (User Defined)
For the above merge conflict, the resolution may be the following:
Component Class
Merge Conflict
Solution
Earthworks
Cost Units
357 (sum)
Base
Cost Units
357 (sum)
Surface
Cost Units
2142 (sum)
Surface
Treatment
10mm Seal
Following the merge, Twynam Avenue is now one (1) distinct Asset whose Components could be represented by the following attribute data set:
Description
Component Class
Cost Units
Units of Measure
Treatment
Twynam Avenue Earthworks
Earthworks
357
metres
nil
Twynam Avenue Base
Base
357
metres
300mm Compacted Gravel Base
Twynam Avenue Seal
Surface
2142
square metres
10mm Seal
When a Merge can Occur
The following restrictions are enforced by the system when a user attempts to perform an Asset Merge operation:
At least two (2) Assets must be submitted for merge.
All Assets within the merge operation must share the same Asset Classification.
The construction/Intervention dates of the Components cannot be after the posting date.
The status effect of the Components must be active.
The Component must have no Transaction postings that occur after the posting date.
The posting date must not conflict with a Locked Financial Year.
For each Component Group, the Finance Category for associated Capital Value must be the same.
The Asset Components must not have any outstanding WIP transactions (from a Capital Budget process).
The Assets or Components must not have any outstanding Programming Tasks.
Resources Assigned to the New Asset
Following an Asset Merge, the following resources are migrated to the new Asset. They are discussed in detail below.
Original Attribution (with consideration for any merge conflict instruction)
Transaction Summary
Condition (with consideration for any merge conflict instruction)
Report Categories (with consideration for any merge conflict instruction)
Original Attribution
The Asset/Component record that is created will inherit it’s attribution from the original Assets or relevant Components. Attributes are copied to the new Assets and Components unchanged (excepting any merge conflict instrucitons).
Transaction Summary
Each new Component record that is created will inherit a combined baseline value from the original relevant Components and the original Componens Value is written-off. This means there is ZERO change in overall value in the system. Consider the following merge of two (2) Components into one (1) new Component.
The original transaction schedule would look something like this, with the carrying value displayed at the bottom. For Component 1,
Comp ID
Year
Transaction Type
Value
comp_1
2015
Recognition (Gross)
$1500
comp_1
2016
Annual Depreciation
-$150
comp_1
2017
Annual Depreciation
-$150
comp_1
2018
Annual Depreciation
-$150
comp_1
2019
Annual Depreciation
-$150
$900
For Component 2,
Comp ID
Year
Transaction Type
Value
comp_2
2015
Recognition (Gross)
$2000
comp_2
2016
Annual Depreciation
-$200
comp_2
2017
Annual Depreciation
-$200
comp_2
2018
Annual Depreciation
-$200
comp_2
2019
Annual Depreciation
-$200
$1200
As a part of the Asset Merge operation, the following transaction schedule would be generated and applied. Note: transaction schedule simplified to years for the example.
Comp ID
Year
Transaction Type
Value
Comment
comp_1
2020
Adjustment (Depreciation)
$600
Writing off the accumulated depreciation
comp_1
2020
Adjustment (Gross)
-$1500
Writing off the gross value
comp_2
2020
Adjustment (Depreciation)
$800
Writing off the accumulated depreciation
comp_2
2020
Adjustment (Gross)
-$2000
Writing off the gross value
comp_3
2020
Recognition (Gross)
$3500
Bringing on the sum of gross value to the merged new Component.
comp_3
2020
Recognition (Gross)
-$1400
Bringing on the sum of accumulated depreciation to the merged new Component.
By the end of the process, the valuation summary for ALL Components would be:
Comp ID
Gross Value
Depreciation Value
Carrying Value
comp_1
$0
$0
$0
comp_2
$0
$0
$0
comp_3
$3500
-$1400
$2100
$3500
-$1400
$2100
Condition
For the newly created Component, the relevant Condition is copied across in a merge operation. On conflict, the user will be asked to choose which Condition value should be applied.
Report Categories
For the newly created Components, the LATEST (as at the Effective Date) relevant Report Categories are copied across in a merge operation. That is, if a Component held a Special Schedule 7 Category of ‘Roads’ at the Effective Date, each new Component would inherit this Report Category. This is, of course, subject to any merge conflict instructions.
What happens to the Original Assets and Components
Following an Asset Merge operation, the original Assets and ALL of their Components are marked with a status code of ‘Deprecated’. This is a special system status code (that users cannot access) which marks the record as ‘superseded by another record or records’. Deprecated records remain in the system, but they are excluded from the default map view, tables, filters, dashboards, and reports.
Information associated with a Deprecated Asset record can be fetched via the NEW Asset record(s). Each new record maintains a ‘Deprecated Parent’ linkage back to the original Asset.
Reclassifying Assets/Components
An Assets Classification configuration controls a great deal of behaviour within the Metrix
Asset Management system. From custom form definitions & cost unit formulas, to depreciable flags
& suggested intervention treatments, the Classification configuration is fundemental in
controlling and streamlining your Asset workflows.
Info
Reclassification occurs in-situ within the Asset and Component record.
That is to say, the process does NOT require the deprecation of the original Asset(s)
or Component(s), and creation of new/replacement records.
Types of Reclassification
Given the signifigance of the Classifications role, it can be neccesary (from time to time) to
Reclassify either:
Assets to an entirely different Asset Classification, or,
Components (within an Asset) to a different Component Type on the Asset Classification.
This is where the Reclassification tool within Metrix can be of assistance. The
Reclassification tool guides users through the process of performing one of the above
types of Reclassification on one or more Assets - that is, both single and bulk workflows
are supported.
Component Type Mapping
Once you choose a target Asset Classification (for full Asset Reclassification), or specify that
your are simply Reclassifying Components within their Asset, the system will guide you through
a process of mapping Component Types. This process can be performed in a number of different
ways, depending on the type of Reclassification being performed.
Full Asset Reclassification
For each Component Type in your source Asset Classification, you will be asked to assign/map
those records to a Component Type from the target Asset Classification.
For example: Consider a source Classification that contains ‘Earthworks’, ‘Base’, & ‘Seal’,
and a target Classification that contains ‘Formation’, ‘Base’, & ‘Surface’. You may choose
a Component Type mapping configuration such as the following:
Earthworks > Formation
Base > Base
Seal > Surface
Reclassifying Components within an Asset
For each Component type within the current Asset Classification, you will be asked to
assign/map/skip those records to a different Component Type within the Classification.
For example: Consider an Asset that contains ‘Earthworks’, ‘Base’, & ‘Seal’,
and its Classification configuration contains ‘Earthworks’, ‘Base’, ‘Seal’ & ‘Surface’. You may choose
a Component Type mapping configuration such as the following:
Earthworks > Skip
Base > Skip
Seal > Surface
This would reclassify the selected ‘Seal’ Component Types to a ‘Surface’ Component Type. Nothing
would happen to the ‘Earthworks’ or ‘Base’ Components.
Finance Re-Categorisation
A component’s finance category is defined by the first entry into the financial transactions ledger
posted against that component. Following that, all transactions against that component will utilise
that same finance category. To change a component’s finance category, the adjustment must be
recorded through the financial transactions ledger as a movement off the original category, and then
on to the new category.
Below is a summary of the involved movements posted during a financial re-categorisation from ‘Roads’ to
‘Footpaths’.
Category
Transaction Type
Value
Roads
Reclassification (Accumulated Depreciation)
$150
Roads
Reclassification (Gross)
-$200
Footpaths
Reclassification (Gross)
$200
Footpaths
Reclassification (Accumulated Depreciation)
-$150
$0
Note: In the above example, the gross value is $200, and the accumulated depreciation is -$150
In the above schedule, the process involves:
Writing off the accumulated depreciation value from the old category
Writing off the gross value from the old category
Writing on the gross value for the new category
Writing on the accumulated depreciation value for the new category
Importantly, the net change in carrying value for the component is zero.
Deprecated Records
Following an action that results in assets or components being regenerated into a new entity, the original records will be marked as ‘deprecated’. This is a special system status code (that users cannot access) which marks the record as ‘superseded by another record or records’. Deprecated records remain in the system, but they are excluded from the default map view, tables, filters, dashboards, and reports.
Information associated with a Deprecated records can be fetched via the NEW (replacing) record(s). Each new record maintains a ‘Deprecated Parent’ linkage back to the original record. This can
be accessed via the
Actions menu at the top of the info panel.
How To Guides
This section provides guidance on how to perform specific Asset Management actions in the Metrix
Asset Management system, for existing records. Including:
The ability to split an Asset is vitally important in keeping the Organisation’s financial reporting,
engineering concepts, and asset management data policies in sync. This section provides an overview
on two different methods supported by the Metrix Asset Management system to perform spatial,
linear bisections of your assets or asset components.
For a basic overview of how splitting works, please see the video below:
Subsections of Splitting Assets or Components
Split Assets
To perform a spatial split of an asset and its components, follow these steps:
Navigate to the main ‘Assets’ page and make a
selection
from the map screen.
Info
For splitting assets, a particular component selection within the asset is not relevant.
At the top of the info panel, click the ‘Actions’ menu.
From the ‘Actions’ menu options, hover or select ‘Parent Asset Actions’ and then choose
‘Split Entire Asset’.
A fly-out panel wil appear with tools ready for you to perform the split operation. Refer to
the section on
Splitting Tools
for an overview of this panel.
Draw a split line across your asset in the panel’s map window. Double-click to finish drawing.
Info
Make sure the splitting plane you digitise, crosses the original asset at least once.
Note also, you can split a single feature MULTIPLE times by drawing in a ‘zig-zag’ fashion.
This is a great way to create more than two (2) sub-features.
Below the map window, use the calendar control to enter the desired posting date which will
be used when apportioning any capital value across the split results.
Once the posting date is selected, the system will prepare a preview of the split that would
be required to suit.
Two or more - depending on the pattern of your digitised split line - asset records, with
relevant child components, will be rendered for your review. Each asset and component displays
the percentage share that they will demand from the original asset. Further to this, this share
is used to calculate the proportion of capital value that each asset component will receive.
When you are happy with the previewed results, click ‘Commit Split (immediate)’
This operation does NOT proceed via staged changes, and occurs immediately. You have successfully
split your asset and its sub-components.
Split Components
To perform a spatial split of a single asset component, follow these steps:
Navigate to the main ‘Assets’ page and make a
selection
from the map screen.
Info
Make sure you have the correct component selected - the one you wish to split
At the top of the info panel, click the ‘Actions’ menu.
From the ‘Actions’ menu options, choose ‘Split Component’.
A fly-out panel wil appear with tools ready for you to perform the split operation. Refer to
the section on
Splitting Tools
for an overview of this panel.
Draw a split line across your component in the panel’s map window. Double-click to finish drawing.
Info
Make sure the splitting plane you digitise, crosses the original component at least once.
Note also, you can split a single feature MULTIPLE times by drawing in a ‘zig-zag’ fashion. This is
a great way to create more than two (2) sub-features.
Below the map window, use the calendar control to enter the desired posting date which will
be used when apportioning any capital value across the split results.
Once the posting date is selected, the system will prepare a preview of the split that would
be required to suit.
Two or more - depending on the pattern of your digitised split line - component records will be
rendered for your review. Each component displays the percentage share that they will demand from
the original component. Further to this, this share is used to calculate the proportion of capital
value that each component will receive.
When you are happy with the previewed results, click ‘Commit Split (immediate)’
This operation does NOT proceed via staged changes, and occurs immediately. You have successfully
split your component.
Explode Multi-Part Features
Multi-geometry spatial features are supported within the Metrix Asset Management system. Sometimes
however, it can become necessary to de-aggregate such features into their constituent building blocks.
This document provides an overview on how to perform such de-aggregation (explode) of geometries
in the system.
Info
Geometry explosion is a COMPONENT level tool. Even if the spatial feature is shared across many
asset components, this operation will only create single-part geometry features for your active
component.
Any components also sharing the multi-geometry will continue to reference the multi-geometry.
Navigate to the main ‘Assets’ page and make a
selection
from the map screen.
Info
Make sure you have the correct component selected - the one you wish to explode
At the top of the info panel, click the ‘Actions’ menu.
From the ‘Actions’ menu options, choose ‘Split Component’.
A fly-out panel wil appear with tools ready for you to perform the operation. At the top
of the panel, choose ‘Explode’.
Use the calendar control to enter the desired posting date which will be used when
apportioning any capital value across the exploded results.
Once the posting date is selected, the system will prepare a preview of the explosion that would
be required to suit.
Two or more - depending on the original multi-geometry - component records will be
rendered for your review. Each component displays the percentage share that they will demand from
the original feature. Further to this, this share is used to calculate the proportion of capital
value that each component will receive.
When you are happy with the previewed results, click ‘Commit Split (immediate)’
This operation does NOT proceed via staged changes, and occurs immediately. You have successfully
exploded your component.
Split Tools
This document provides a brief overview of the splitting
asset and/or
components tools,
and how to use them to generate a valid splitting plane.
The following tools are discussed:
Drawing your Splitting Plane
To draw the splitting plane:
Click on ‘Draw split line’.
In the map window, click to start the splitting plane.
Move the cursor and click again to add vertex nodes to your splitting plane.
To finish, double-click.
To clear the splitting plane and redraw, simply click the redo button next to the ‘Draw split line’ button.
Info
Once drawn, the splitting plane can be edited. Simply click ‘Edit’ and then manage the splitting plane
following these directions.
Measure Guide Line
The splitting panel provides users with the option to generate ‘construction lines’ before committing their split
plan. These ‘construction lines’ will reveal their length for added context for the user. To use the measure tool:
Click on ‘Measure guide line’.
In the map window, click to start the construction line.
Move the cursor and click again to add vertex nodes to your construction line.
To finish, double-click.
The length of your construction line will be calculated and displayed below.
The construction line(s) can be cleared by clicking ‘Clear Construction Layers’.
Map Context
The built-in map window in the split panel contains controls to toggle aerial imagery, basemaps, as well as the
Metrix mapping focus mode. Set these views accordingly to provide yourself with the required context to draw
the split plane.
For information about each setting, read below.
Focus Mode
For nearly all users, there exists a colour combination that is hard to decipher between and thus
difficult to read when displayed in a map window. To cater for this, the Metrix Asset Management
map tools provide users with the ability to put the map backdrop into ‘Focus Mode’. This will
binarise (to make black-and-white) the backdrop so that the colours of your asset portfolio are
easier to distinguish.
View Aerial Imagery as Backdrop
To view the aerial imagery as a backdrop to your asset portfolio, simply click on the ‘Imagery’
button in the top-left hand corner of the map window. This will swap out the underlying view to
the aerial photograph imagery configured for your environment. The screenshot below shows a map window
with aerial imagery as the backdrop, split between focus mode and standard.
View Basemap as Backdrop
To view the basemap as a backdrop to your asset portfolio, simply click on the ‘Base’
button in the top-left hand corner of the map window. This will swap out the underlying view to
the basemap configured for your environment. The screenshot below shows a map window
with basemap as the backdrop, split between focus mode and standard.
Merging Assets
From time to time, your network of assets may become too bifurcated. For these scenarios, the Metrix
Asset Management system has support for users merging assets.
Merge Assets
To merge two or more asset records:
Navigate to the main ‘Assets’ page and make a
collection
from the map screen. This will represent the assets you wish to merge together as one.
From the Collections side-bar options, choose ‘Perform Merge within Collection’.
Confirm the Asset Classification of the Assets that you wish to merge. This step is
provided to prevent accidental merge of adjacent assets/components.
Confirm the selected records (within the Assset Classification) that will be merged.
This is essentially a preview of what you have selected, once again to prevent accidental
merge of adjacent assets/components. Click ‘Continue’.
Supply a Posting Date, if required. If the underlying Asset(s) have any capital value, you
will be prompted for a Posting Date value. Enter a Posting Date if required. Then click
‘Generate Merge Preview’.
The system will analyse the request and return a preview of the merge operation, along
with any merge conflicts discovered.
Navigate through the tabs of ‘Asset Data’, and ‘Component Group Data’. At the top of each
tabbed section, a highlight will detail any merge conflicts within the tab that MUST
be resolved. Review the data in each tab, resolve any merge conflicts, and generally
review the data that will be created on the new merged record(s).
Once on the ‘Finalise and Review’ tab, you can click ‘Complete Merge’. This will commit the
merge operation.
Reclassification
From time to time, an organisation’s asset infrastructure will undergo different purposes - or data
management practices may adjust. In these cases, it can become necessary to Reclassify Assets and/or
Components to different Asset Classifications (or Component Types). This section provides an overview
on two different methods supported by the Metrix Asset Management system to perform Reclassification
of Assets (including the Asset Components) or Components.
To reclassify a single Asset and its Asset Components, perform the following steps:
Navigate to the main ‘Assets’ page and make a
selection
from the map screen.
At the top of the info panel, click the ‘Actions’ menu.
From the ‘Actions’ menu options, hover or select ‘Parent Asset Actions’ and then choose
‘Reclassify Asset’. Note, if the Info Panel is already focused on the Parent Asset
record, the ‘Reclassify Asset’ will be in the initial Actions menu.
A fly-out panel will appear with the required tools for performing an asset reclassification.
Set the the ‘Reclassification Mode’ to ‘Asset Reclassification’.
From the ‘Target Asset Classification Mapping’ control, choose the Asset Classification
that you are reclassifying the asset to.
Choose the asset class from the left hand side of the drop-down list first, and then refine
to the asset classification. The search box at the top of the drop-down list can also
be used to limit the options.
Once the asset classification has been chosen, the ‘Component Mapping’ section will become
active. Each of the active asset’s components must be matched to a corresponding target asset
classification component group.
For each row in the mapping list, select the ‘New Component Type’ on the right-hand side.
Warning
ALL current Components must have a target Component Type in the target Asset Classification.
With the component mapping complete, use the calendar control to set the desired ‘Effective Date’
for the operation to occur.
You can now proceed to ‘Preview the Reclassification’. This will submit your settings to
test if the reclassification will be valid. In the case that any issues are found, these
will be returned to you and rendered just above the preview button.
This process is essentially checking that the two classifications are compatible, and that
any data loss can be avoided.
Once the preview has succeeded without errors, and when you are ready with the proposed
reclassification, click ‘Reclassify (immediate)’.
Bulk Asset Reclassification
To reclassify a number of Assets and their Asset Components, perform the following steps:
Navigate to the main ‘Assets’ page and build a
collection
from the map screen.
From the Collections panel, in the ‘Collection Actions’ section, choose ‘Reclassify Collection’.
A fly-out panel will appear with the required tools for performing an asset reclassification.
Before you start however, the system will review your collection to ensure it contains just
one distinct Asset Classification. If more than one is found, don’t panic, the system will
guide you through refining your collection so that the scope of the collection is reduced to
a single classification.
With a single classification confirmed, set the ‘Reclassification Mode’ to ‘Asset Reclassification’.
From the ‘Target Asset Classification Mapping’ control, choose the Asset Classification
that you are reclassifying the asset to.
Choose the asset class from the left hand side of the drop-down list first, and then refine
to the asset classification. The search box at the top of the drop-down list can also
be used to limit the options.
Once the asset classification has been chosen, the ‘Component Mapping’ section will become
active. Each of the Component Types within the source Asset Classification must be matched
to a corresponding target Component Type within the target Asset Classification.
For each row in the mapping list, select the ‘New Component Type’ on the right-hand side.
Warning
ALL current Component Types must have a target Component Type in the target Asset Classification.
Note: This is slightly different to the single asset reclassification mode, where the mapping is
performed at the individual component level. In bulk reclassification, the mapping is performed
at the component type level. This means that all components of a given type will be reclassified
to the same target component type.
With the component mapping complete, use the calendar control to set the desired ‘Effective Date’
for the operation to occur.
You can now proceed to ‘Preview the Reclassification’. This will submit your settings to
test if the reclassification will be valid. In the case that any issues are found, these
will be returned to you and rendered just above the preview button.
This process is essentially checking that the two classifications are compatible, and that
any data loss can be avoided.
Once the preview has succeeded without errors, and when you are ready with the proposed
reclassification, click ‘Reclassify (immediate)’.
Reclassify Components within Asset Classification
For reclassifying Components between Component Types within their Asset Classification, there
are two (2) methods available. Each of these processes are outlined in this document:
To reclassify a component within its parent asset, perform the following steps:
Navigate to the main ‘Assets’ page and make a
selection
from the map screen.
At the top of the info panel, click the ‘Actions’ menu.
From the ‘Actions’ menu options, hover or select ‘Parent Asset Actions’ and then choose
‘Reclassify Asset’. Note, if the Info Panel is already focused on the Parent Asset
record, the ‘Reclassify Asset’ will be in the initial Actions menu.
A fly-out panel will appear with the required tools for performing an asset reclassification.
Set the the ‘Reclassification Mode’ to ‘Component Reclassification’.
Info
There is no need to choose a target asset classification, as the components are being
reclassified within their current asset classification.
The target Asset Classification control will be disabled when you choose ‘Component Reclassification’
mode.
Once the mode has been set, the ‘Component Mapping’ section will become active.
Each of the active Asset’s Components can be matched to a corresponding Component Type
within the Parent Asset’s Asset Classification.
For components in the mapping list that you wish to reclassify to a different Component Type,
select the ‘New Component Type’ on the right-hand side. Otherwise, leave it set to ‘Skip’.
With the component mapping complete, use the calendar control to set the desired ‘Effective Date’
for the operation to occur. This defaults to the current date.
You can now proceed to ‘Preview the Reclassification’. This will submit your settings to
test if the reclassification will be valid. In the case that any issues are found, these
will be returned to you and rendered just above the preview button.
This process is essentially checking that the Component Types are compatible, and that
any data loss can be avoided.
When you are ready with the proposed reclassification, click ‘Reclassify (immediate)’.
Bulk Reclassification of Components within Asset Classification
To reclassify components within their parent assets in bulk (across many Assets), perform
the following steps:
Navigate to the main ‘Assets’ page and make a
collection
from the map screen.
From the Collections panel, in the ‘Collection Actions’ section, choose ‘Reclassify Collection’.
A fly-out panel will appear with the required tools for performing an asset reclassification.
Before you start however, the system will review your collection to ensure it contains just
one distinct Asset Classification. If more than one is found, don’t panic, the system will
guide you through refining your collection so that the scope of the collection is reduced to
a single classification.
With a single classification confirmed, set the the ‘Reclassification Mode’ to ‘Component Reclassification’.
Info
There is no need to choose a target asset classification, as the components are being
reclassified within their current asset classification.
The target Asset Classification control will be disabled when you choose ‘Component Reclassification’
mode.
Once the mode has been set, the ‘Component Mapping’ section will become active.
Each of the Component Types within the Asset Classification can be matched a
different Component Type within the Asset Classification, or left unchanged.
Info
Note: This is slightly different to the single component reclassification mode, where the mapping is
performed at the individual component level. In bulk reclassification, the mapping is performed
at the component type level. This means that all components of a given type will be reclassified
to the same target component type.
With the component mapping complete, use the calendar control to set the desired ‘Effective Date’
for the operation to occur. This defaults to the current date.
You can now proceed to ‘Preview the Reclassification’. This will submit your settings to
test if the reclassification will be valid. In the case that any issues are found, these
will be returned to you and rendered just above the preview button.
This process is essentially checking that the Component Types are compatible, and that
any data loss can be avoided.
When you are ready with the proposed reclassification, click ‘Reclassify (immediate)’.
Financial Re-Categorisation
To perform a financial re-categorisation, firstly, ensure that you understand the
purpose and implications
of such a process. Then, simply follow these steps.
Navigate to the main ‘Assets’ page and make a
selection
from the map screen.
Ensure the correct asset component is your active selection.
Within the transactions info panel is a section title ‘Transaction History’. It is here
that users can see past recorded movements, as well as perform financial re-categorisations.
At the top of the ‘Transaction History’ section, click on the ‘Reclassify’ button.
Info
If the summary table and/or the ‘Reclassify’ button is not displayed for your active
component, it typically means that the asset component does not have any transactions
posted against it. This therefore indicates that re-categorisation is NOT necessary.
A fly-out panel will display, requiring the target finance category and posting date
for the change to occur.
Enter the posting date for the financial re-categorisation to occur using the calendar
input.
Select the target finance category from the drop-down list.
Provide an optional comment.
Click ‘Reclassify’ when ready.
This operation does NOT proceed via staged changes, and occurs immediately. You have successfully
re-categorised your component.
Set Component Status
This section provides an overview on how to alter a component’s status code in the Metrix
Asset Management system:
Navigate to the main ‘Assets’ page and make a
selection
from the map screen.
Info
Make sure you have the correct component selected - the one you wish to update the status for
The component’s status is referenced toward the top of the ‘Info’ tab in the component information panel.
To the right of this label, exists an option to ‘Update Status’ for the active component. Click this drop
down list and choose the desired status from the options presented.
Alternatively, setting the status in an option in the Info Panel ‘Actions’ menu.
From the ‘Actions’ menu, choose ‘Set Component Status’ and then, from the sub-menu,
choose the target component status that you wish to set.
A fly-out panel will appear seeking confirmation for the status change. If the target status
effect is ‘inactive’, the system will also generate the required financial transactions
ledger postings required to successfully set the status.
These transactions are designed to ensure that ‘inactive’ components (i.e. disposed) do not
carry any value or have any gross value. If you proceed, the transactions will be posted to
your ledger.
Once satisfied with the proposed change, click the confirmation button at the bottom of the panel.
This operation does NOT proceed via staged changes, and occurs immediately. You have successfully
updated the status on your component.
Deleting Assets & Components
From time to time, you may create a new asset or asset component and that eventuates to being a mistake.
For these scenarios, the Metrix Asset Management system has support for users deleting assets or
asset components.
Warning
Delete operations cannot be undone.
Assets and/or components that have financial transactions ledger entries within a locked
financial period, cannot be deleted.
Assets must contain at least one (1) active component, so the last remaining component of
an asset cannot be deleted.
Delete Assets
To delete an asset record and its asset components:
Navigate to the main ‘Assets’ page and make a
selection
from the map screen.
At the top of the info panel, click the ‘Actions’ menu.
From the ‘Actions’ menu options, hover or select ‘Parent Asset Actions’ and then choose
‘Delete Asset’.
The asset deletion has been STAGED and is ready to
save.
Delete Component
To delete an asset component from a parent asset:
Navigate to the main ‘Assets’ page and make a
selection
from the map screen.
Info
Make sure you have the correct component selected - the one you wish to delete.
At the top of the info panel, click the ‘Actions’ menu.
From the ‘Actions’ menu options, choose ‘Delete Component’.
The component deletion has been STAGED and is ready to
save.