How To Guides
This section provides an overview on the following Report Generation topics:
This section provides an overview on the following Report Generation topics:
To generate a new report in the Metrix Asset Management system, follow these steps:
Navigate to the ‘Reports’ page of the application.

Reports are grouped into sections of common themes and each report is represented by a tile with a label and brief description. Click on your desired report. See Report Generation: About for further information about specific reports.
The report configuration/preview page will load. Depending on the selected report template, a number of configuration options may be present on the left, whilst on the right-hand side, a preview of the report will be shown. Make sure you provide a setting for any required report configuration settings by scrolling through the left-hand side section.
Some reports will display additional options when certain configuration settings are switched. Try applying a ‘Custom Filter’ to the ‘Component Data Export’. The option to include ‘Custom Attributes’ will then be shown.
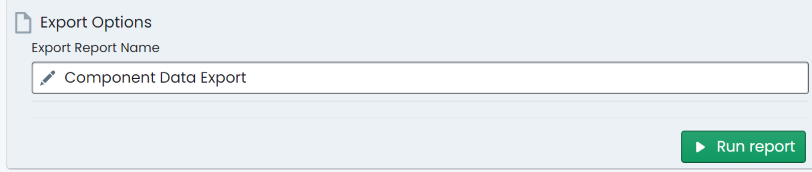
Once configured, update the name for your report (optional - a default name is pre-populated), and click ‘Run report’.
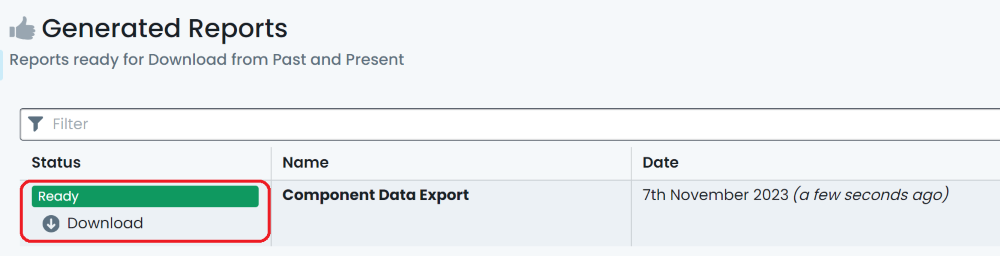
The report has now been queued for generation. The application will navigate to the generated reports page where past
reports are listed for download. At the top of this list, the report you just created will be listed with a status flag in the
left-most column. Once it is displayed as ‘Ready’, click the ‘Download’ option for that report.
Depending on your browser settings, you may be prompted for a ‘save’ location for the generated report. Save the file to your computer. You have now generated and downloaded a report from Metrix.
Each report generated in the Metrix Asset Management system is available for download at any time, via the ‘Generated Reports’ page. To view and download a past report, follow these steps:
Navigate to the ‘Reports’ page of the application.
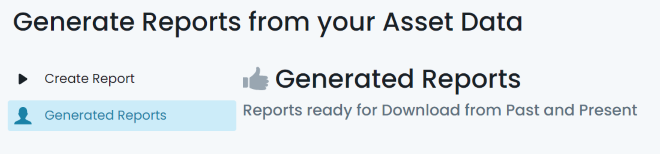
Click on the ‘Generated Reports’ option on the left-hand side of the page.
On this page, past reports are listed for download in a chronological order (by the date they were created). For
the report you wish to view, click the ‘Download’ option for that report.
Depending on your browser settings, you may be prompted for a ‘save’ location for the generated report. Save the file to your computer.
The Metrix Asset Management system offers the Cost to Bring to Satisfactory Report as a built-in report template for users. This report calculates intervention metrics for components based on their condition a pre-defined factor set. This guide details how to create and manage such factor sets.
Navigate to the ‘Reports’ page of the application.
From the report template list, select ‘Cost to Bring to Satisfactory Report’.
This will take you to the generation/configuration page for this report option. The current chosen ‘Factor Set’ will
be active in the ‘Report Factor Set’ drop-down. If you have never created your own ‘Factor Set’, this will be a system
default set.
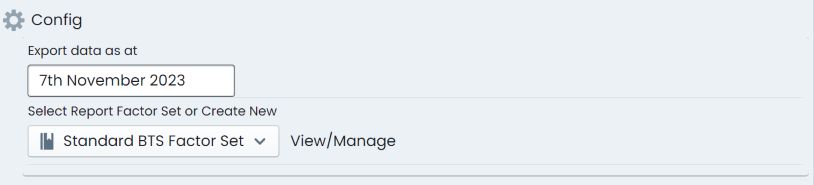
To create a new ‘Factor Set’, select ‘Create New Factor Set’ from the drop-down list options. To edit the active ‘Factor Set’, click on ‘View/Manage’ next to the drop-down list.
If creating a new ‘Factor Set’, enter a ‘Factor Set Name’ in the text input box. Then select the ‘Report Category’ for which this ‘Factor Set’ will apply to. If editing, the existing ‘Factor Set’, click ‘Edit’.
For each option configured for the report category, an array of factors will be generate per scaled condition score of 1-5. These are placeholders for you to replace with your actual factors. To set the factors, there are two options:
The top row of the list is reserved for global assignment. That is, this row does not pertain to a particular report category option - it is there to allow you to set a figure that will be replicated across ALL report category options below.
Excepting the top row, each row represents a configured report category option. These rows can be individually managed by inputting values directly.
First, choose a factor base as ‘Replacement Value’ or ‘Carrying Value’. This is the metric that will be multiplied by the report factor per scaled condition score.
or each scaled condition score across the row, input the desired report factor from 0% to 100%.
When you have finished, click ‘Save’ at the top of the table.