Using Map Themes (Visualisations)
This document provides an overview on how to use the built-in custom map themes in the Metrix Asset Management system.
The Metrix Asset Management system controls spatial features at a component level. When viewing some map themes, there may be overlapping shapes caused by stacked geometries of multiple asset components. This can cause obscuration and/or blending of the rendered colours.
In these cases, it is advisable to filter your data to a specific component group.
-
To get started, navigate to the main ‘Assets’ map in the Metrix Asset Management system.
-
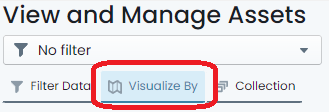
On the left hand side of the page, make sure the ‘Visualise By’ tab is activated.
 .
. -
Initially, you will see a map legend for the currently applied map theme. By default, this is set to colour switch on ‘Asset Class’. To change the map theme to a different pre-configured visualisation, simply click ‘Switch Map Theme’ at the top of the panel.
-
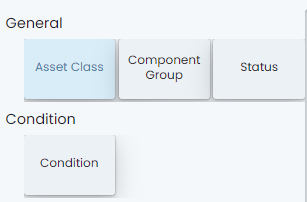
This will now display all of the available built-in map themes in a range of contextual categories.
 .
. -
To apply a specific visualisation, simply click on the tile in this view.
-
The theme will apply, and you will be returned to the ‘Legend View’ as it pertains to your chosen theme.
-
Repeat this process to go to another theme.
InfoRemember, the default map theme is called ‘Asset Class’. Choosing this theme will essentially reset your visualisations to system standard.